Exercise 3.1Z: Triangular PDF
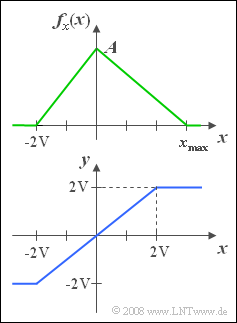
We consider a continuous random variable x with the PDF outlined on the right.
- The minimum value of the signal is xmin=−2V.
- On the other hand, the maximum value xmax is a free parameter, allowing values between +2V and +4V.
The random variable x is to be understood here as the instantaneous value of a random signal. If this signal x(t) is applied to an amplitude limiter with the characteristic curve (see sketch below)
- y(t)={−2Vifx(t)<−2V,x(t)if−2V≤x(t)≤+2V,+2Vifx(t)>+2V,
so the signal y(t) or the new random variable y, which is considered in the last two subquestions (5) and (6) is obtained.
- For the subtasks (1) and (2) apply xmax=2V.
- For all other subtasks, set xmax=4V .
Hints:
- The task belongs to the chapter Probability Density Function.
- The topic of this chapter is illustrated with examples in the (German language) learning video
"Wahrscheinlichkeit und WDF" ⇒ "Probability and PDF".
Questions
Solution
(1) The area under the PDF must always yield the value 1. It follows that:
- A/2⋅4V=1⇒A=0.51/V_.
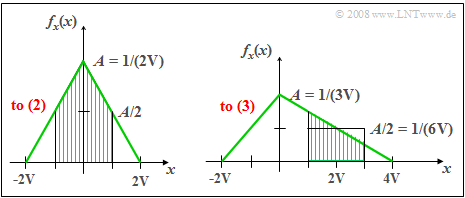
(2) With xmax=+2V the PDF is obtained according to the left graph.
- The shading marks the probability we are looking for.
- One obtains by simple geometric considerations:
- Pr(|x|<1V)=0.75_.
(3) With xmax=+4V one obtains the PDF shown on the right.
- The maximum value is now A=1/(3V).
- The shaded area again indicates the probability we are looking for, which can be determined using the rectangle of equal area:
- Pr(1V<x<3V)=16V⋅2V=0.333_.
(4) Since x represents a continuous random variable, this probability is by definition zero ⇒ Pr(x=2V)=0_.
(5) Only the last statement of the given answers is true:
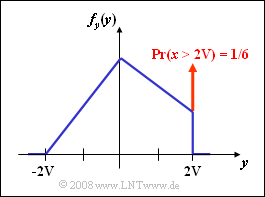
- The PDF fy(y) includes a continuous component (drawn in blue),
- but also the (red) Dirac delta function at y=+2V with weight Pr(x>2V).
(6) The graphic on the right shows the probability density function of the random variable y.
- From the right figure for subtask (3) one can see the relation:
- Pr(y=2V)=Pr(x>2V)=12⋅16V⋅2V=1/6=0.167_.


