Contents
Complex propagation function of coaxial cables
Coaxial cables consist of an inner conductor and – separated by a dielectric – an outer conductor. Two different types of cable have been standardized, with the diameters of the inner and outer conductors mentioned for identification purposes:
- the »standard coaxial cable« whose inner conductor has a diameter of 2.6 mm and whose outer diameter is 9.5 mm,
- the »small coaxial cable« with diameters 1.2 mm and 4.4 mm.
The cable frequency response HK(f) results from the cable length l and the complex propagation function (per unit length)
- γ(f)=α0+α1⋅f+α2⋅√f+j⋅(β1⋅f+β2⋅√f)⇒HK(f)=e−γ(f)⋅l⇒|HK(f)|=e−α(f)⋅l.
The cable specific constants for the »standard coaxial cable« (2.6/9.5 mm) are:
- α0=0.00162Npkm,α1=0.000435Npkm⋅MHz,α2=0.2722Npkm⋅√MHz,β1=21.78radkm⋅MHz,β2=0.2722radkm⋅√MHz.
Accordingly, the kilometric attenuation and phase constants for the »small coaxial cable« (1.2/4.4 mm):
- α0=0.00783Npkm,α1=0.000443Npkm⋅MHz,α2=0.5984Npkm⋅√MHz,β1=22.18radkm⋅MHz,β2=0.5984radkm⋅√MHz.
These values can be calculated from the geometric dimensions of the cables and have been confirmed by measurements at the Fernmeldetechnisches Zentralamt in Darmstadt - see [Wel77][1]. They apply to a temperature of 20∘ C (293 K) and frequencies greater than 200 kHz.
There is the following connection to the »primary line parameters«:
- The ohmic losses originating from the frequency-independent component R′ are modeled by the parameter α0 and cause a (for coaxial cables small) frequency-independent attenuation.
- The component α1·f of the »attenuation function (per unit length)« is due to the derivation losses (G′) and the frequency-proportional term β1·f causes only delay but no distortion.
- The components α2 and β2 are due to the »skin effect«, which causes the current density inside the conductor to be lower than at the surface in the case of higher-frequency alternating current. As a result, the »serial resistance (per unit length)« R′ of an electric line increases with the square root of the frequency.
Characteristic cable attenuation
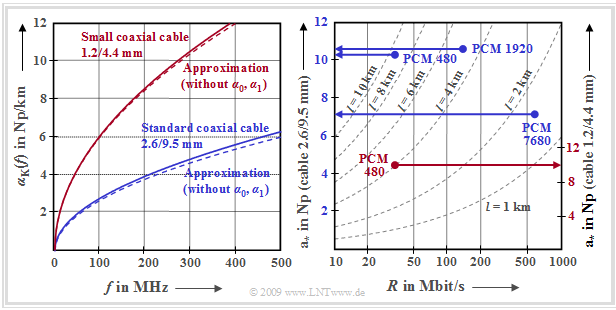
The graph shows the frequency-dependent attenuation curve for the normal coaxial cable and the small coaxial cable. Shown on the left is the cable attenuation per unit length of the two coaxial cable types in the frequency range up to 500 MHz:
- αK(f)=α0+α1⋅f+α2⋅√f.
- ⇒aK(f)=αK(f)⋅l
Notes on the representation chosen here
- To make the difference between the attenuation function per unit length »alpha« and the function »a« (after multiplication by length) more recognizable, the attenuation function is written here as aK(f) and not (italics) as aK(f).
- The ordinate labeling is given here in »Np/km«. Often it is also done in »dB/km«, with the following conversion:
- ln(10)/20=0.11513...⇒1 dB=0.11513... Np.
Interpretation of the left graph
- It can be seen from the curves shown that the error is still tolerable when neglecting the frequency-independent component α0 and the frequency-proportional term (α1⋅f).
- Sometimes, we assume the »simplified attenuation function«:
- aK(f)=α2⋅√f⋅l=a⋆⋅√2f/R⇒|HK(f)|=e−aK(f),aK(f)inNp.
Definition: We denote as »characteristic cable attenuation« a∗
- the attenuation of a coaxial cable at half the bit rate
- due to the α2 term alone ⇒ »skin effect«, thus neglecting the α0 and the α1 term:
- a⋆=aK(f=R/2)=α2⋅√R/2⋅l.
This value is particularly suitable for comparing different conducted transmission systems with different
- coaxial cable types (normal or small coaxial cable), each identified by the parameter α2,
- bit rates (R), and
- cable lengths (l).
Interpretation of the right graph
The right–hand diagram above shows the characteristic cable attenuation a∗ in »Neper« (Np) as a function of the bit rate R and the cable length l for
- the normal coaxial cable (2.6/9.5 mm) ⇒ left ordinate labeling, and
- for the small coaxial cable (1.2/4.4 mm) ⇒ right ordinate labeling.
This diagram shows the PCM systems of hierarchy levels 3 to 5 proposed by the ITU-T (»ITU Telecommunication Standardization Sector«) in the 1970s. One recognizes:
- For all these systems for PCM speech transmission, the characteristic cable attenuation assumes values between 7 Np (≈61 dB) and 10.6 Np (≈92 dB) .
- The system PCM 480 – designed for 480 simultaneous telephone calls - with bit rate R≈35 Mbit/s was specified for both the normal coaxial cable (with l=9.3 km) and the small coaxial cable (with l=4 km). The a∗–values 10.4 Np resp. 9.9 Np are in the same order of magnitude.
- The system PCM 1920 of the fourth hierarchy level (specified for the normal coaxial cable) with R≈140 Mbit/s and l=4.65 km is parameterized by a∗=10.6 Np or 10.6 Np·8.688 dB/Np≈92 dB .
- Although the system PCM 7680 has a four times greater bit rate R≈560 Mbit/s , the characteristic cable attenuation of a∗≈61 dB is due to the better medium »normal coaxial cable« and the shorter cable sections (l=1.55 km) by a factor of 3 significantly lower .
- These numerical values also show that for coaxial cable systems, the cable length l is more critical than the bit rate R. If one wants to double the cable length, one has to reduce the bit rate by a factor 4.
You can view the topic described here with the interactive HTLM 5/JavaScript applet »Attenuation of Copper Cables« .
Impulse response of a coaxial cable
To calculate the impulse response, the first two of the in total five components of the complex propagation function (per unit length) can be neglected (the reasoning can be found in the previous section). So we start from the following equation:
- γ(f)=α0+α1⋅f+j⋅β1⋅f+α2⋅√f+j⋅β2⋅√f≈j⋅β1⋅f+α2⋅√f+j⋅β2⋅√f.
Considering
- the cable length l,
- the characteristic cable attenuation a∗, and
- that α2 (in »Np«) and β2 (in »rad«) are numerically equal,
thus applies to the »frequency response of the coaxial cable«:
- HK(f)=e−j⋅b1f⋅e−a⋆⋅√2f/R⋅e−j⋅a⋆⋅√2f/R=e−j⋅b1f⋅e−2a⋆⋅√j⋅f/R.
The following abbreviations are used here:
- b1(inrad)=β1⋅l,a⋆(inNp)=α2⋅√R/2⋅l.
The time domain representation is obtained by applying the »inverse Fourier transform« and the »convolution theorem«:
- hK(t)=F−1{e−j⋅b1f}⋆F−1{e−2a⋆⋅√j⋅f/R}.
It must be taken into account here:
- The first term yields the Dirac delta function δ(t−τP) shifted by the phase delay τP=b1/2π .
- The second term can be given analytically closed. We write hK(t+τP), so that the phase delay τP need not be considered further.
- hK(t+τP)=a⋆π⋅√2⋅R⋅t3⋅exp[−a2⋆2π⋅R⋅t],a⋆inNp.
- Since the bit rate R also has already been considered in the a∗ definition; this equation can be easily represented with the normalized time t′=t/T :
- hK(t′+τP′)=1T⋅a⋆π⋅√2⋅t′3⋅exp[−a2⋆2π⋅t′],a⋆inNp.
- Here T=1/R denotes »the symbol duration of a binary system« and it holds τP′=τP/T.
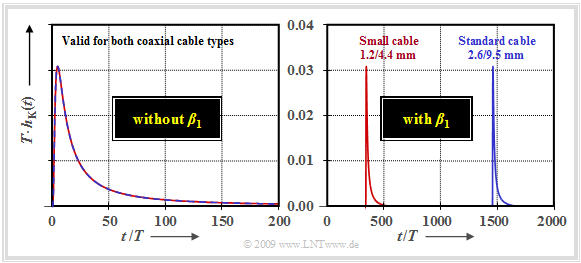
Example 1: The results of this section are illustrated by the following graph as an example.
- The normalized impulse response T·hK(t) of a coaxial cable with a∗=60 dB (6.9 Np) is shown.
- The attenuation coefficients α0 and α1 can thus be neglected, as shown in the last section.
- For the left graph, the parameter β1=0 was also set.
Because of the parameterization by the coefficient a∗, and the time normalization to the symbol duration T the left curve is equally valid
- for systems with small or normal coaxial cable,
- different lengths,
- different bit rates.
For example for
- normal coaxial cable 2.6/9.5 mm, bit rate R=140 Mbit/s, cable length l=3 km ⇒ system A,
- small coaxial cable 1.2/4.4 mm, bit rate R=35 Mbit/s,
cable length l=2.8 km ⇒ system B.
It can be seen in the left–hand diagram that even at this moderate cable attenuation a∗=60 dB the impulse response already extends over more than 200 symbol durations due to the skin effect (α2=β2≠0). Since the integral over hK(t) is equal to HK(f=0)=1, the maximum value becomes very small:
- Max[hK(t)]≈0.03.
In the diagram on the right, the effects of the phase parameter β1 can be seen. Note the different time scales of the left and the right diagram:
- For system A (β1=21.78 rad/(km·MHz), T=7.14 ns) β1 leads to a phase delay of
- τA=β1⋅l2π=21.78rad/(km⋅MHz)⋅3km2π=10.4μs⇒τA′=τA/T≈1457.
- On the other hand, the following can be obtained for system B (β1=22.18 rad/(km·MHz), T=30 ns):
- τB=β1⋅l2π=22.18rad/(km⋅MHz)⋅2.8km2π=9.9µs⇒τB′=τB/T≈330.
Although τA≈τB holds, completely different ratios result because of the time normalization to T=1/R .
Conclusion: When simulating and optimizing transmission systems,
one usually omits the linear phase term b1=β1·f, since this results exclusively in a (often not disturbing) phase delay, but no signal distortions.
Basic receiver pulse
With the »basic transmission pulse« gs(t) ⇒ »basic pulse of the transmitted signal« s(t) and the »impulse response hK(t) of the channel, the result for the »basic receiver pulse« gr(t) ⇒ »basic pulse of the received signal« r(t) is:
- gr(t)=gs(t)⋆hK(t).
If a non-return-to-zero (NRZ) rectangular pulse gs(t) with amplitude s0 and duration Δts=T is used at the transmitter, the following results for the basic pulse at the receiver input:
- gr(t)=2s0⋅[Q(a⋆/√π√(t/T−0.5))−Q(a⋆/√π√(t/T+0.5))].
Here a∗ denotes the »characteristic cable attenuation« (in Neper) and Q(x) the »complementary Gaussian error function«.
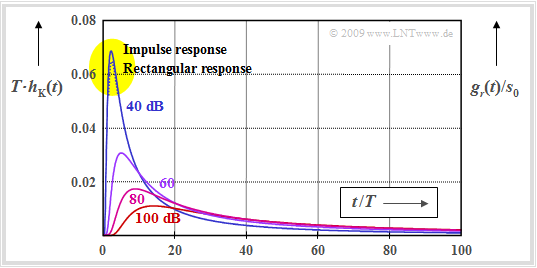
Example 2: The figure shows for the characteristic cable attenuations a∗=40 dB, ... , 100 dB (smaller a∗–values are not relevant for practice)
- the normalized coaxial cable impulse response T·hK(t) ⇒ solid curves,
- the basic receiver pulse (»rectangular response«) gr(t) normalized to the transmission amplitude s0 ⇒ dotted line.
One recognizes the following from this diagram:
- With a∗=40 dB, the normalized basic receiver pulse gr(t)/s0 is at the peak slightly (about a factor of 0.95) smaller than the normalized impulse response T·hK(t). Here is a small difference between impulse response and basic receiver pulse .
- In contrast, for a∗≥60 dB, the basic receiver pulse and the impulse response are indistinguishable within the drawing accuracy.
- For a return-to-zero (RZ) pulse, the above equation for gr(t) would still need to be multiplied by the factor Δts/T. In this case gr(t)/s0 is smaller than T·hK(t) by at least this factor.
- The equation modified in this way is also a good approximation for other basic transmission pulses as long as a∗≥60 dB is sufficiently large. Δts then indicates the »equivalent pulse duration« of gr(t).
Special features of coaxial cable systems
Assuming binary transmission
- with non-return-to-zero (NRZ) rectangular pulses (duration T)
- and a coaxial transmission channel,
the following system model is obtained. In particular, it should be noted:
(1) In a simulation, the phase delay time of the coaxial cable is conveniently left out of consideration. Then the basic receiver pulse gr(t) is approximated by (with a⋆ in Neper):
- gr(t)≈s0⋅T⋅hK(t)=s0⋅a⋆/π√2⋅(t/T)3⋅e−a2⋆/(2π⋅t/T).
(2) Because of the good shielding of coaxial cables against other impairments, the »thermal noise« is the dominant stochastic perturbation. In this case, the signal n(t) is Gaussian and white. It can described by the (two-sided) noise power density N0/2.
(3) By far the largest noise component arises in the input stage of the receiver, so that it is expedient to add the noise signal n(t) at the interface »cable ⇒ receiver«. This noise addition point is also useful because the frequency response HK(f) decisively attenuates all noise accumulated along the cable.
(3) Then the received signal is with the amplitude coefficients aν:
- r(t)=+∞∑ν=−∞aν⋅gr(t−ν⋅T)+n(t).
Exercises for the chapter
Exercise 4.4: Coaxial Cable - Frequency Response
Exercise 4.5: Coaxial Cable - Impulse Response
Exercise 4.5Z: Impulse Response once again
References
- ↑ Wellhausen, H. W.: Dämpfung, Phase und Laufzeiten bei Weitverkehrs–Koaxialpaaren. Frequenz 31, S. 23-28, 1977.


