Contents
- 1 Motivation for Describing in the Equivalent Low Pass Range
- 2 Definition in the Frequency Domain
- 3 Description in The Time Domain
- 4 Definition of The Locus Curve
- 5 Representing with Magnitude and Phase
- 6 Zusammenhang zwischen äquivalentem TP-Signal und BP-Signal
- 7 Warum gibt es für das gleiche Signal drei Darstellungsformen?
- 8 Darstellung nach Real- und Imaginärteil
- 9 Ermittlung des äquivalenten TP-Signals aus dem BP-Signal
- 10 Leistung und Energie eines Bandpass-Signals
- 11 Exercises for The Chapter
Motivation for Describing in the Equivalent Low Pass Range
The following figure shows a possible structure of a message transmission system:
- Often the low frequency source signal $q(t)$ is converted into a bandpass signal $s(t)$ ⇒ 'modulation.
- After transmission, the received signal $r(t)$ - compared to the transmit signal $s(t)$ possibly distorted and with (noise) interference applied - must be reset to the original frequency range ⇒ 'Demodulation.
- The sink signal $v(t)$, which should match the source signal $q(t)$ as closely as possible, is then again a low pass signal.
Modulation and demodulation are therefore fundamental components of a transmission system, which are dealt with in detail in the book Modulation Methods . A short summary can be found in the first chapter Principles of Message Transmission of this book.
The investigation, simulation, optimization, and dimensioning of bandpass systems are mostly done in the 'equivalent low pass range, for which the following reasons can be given
- If quality characteristics (bandwidth efficiency, signal-to-noise ratio, bit error rate, power requirements, etc.) of a low pass system are known, the corresponding values of related bandpass systems can be derived from them relatively easily. Examples are the digital modulation methods Amplitude Shift Keying (ASK) and Binary Phase Shift Keying (BPSK), whose performance variables can be "extrapolated" from the comparable baseband system (i.e., without modulator and demodulator).
- Individual subchannels in a so-called frequency division multiplex system, which differ by different carrier frequencies, can often be considered qualitatively equivalent. Therefore, it is sufficient to limit the calculation and dimensioning to a single channel and to perform these investigations in the equivalent low-pass range - i.e. without considering the specific carrier frequency.
- t is often the case that the bandwidth of a communication connection is orders of magnitude smaller than the carrier frequency. For example, in the GSM standard  the individual channels are located in the frequency range around $900\ \rm MHz$ („D-Network”) and $1800\ \rm MHz$ („E-Network”), while each channel has only a small bandwidth of $200\ \rm kHz$ available. Therefore a simulation in the equivalent low pass range is much less complex than a simulation of the corresponding bandpass signals.
Definition in the Frequency Domain
We consider a real bandpass signal $x(t)$ with the spectrum $X(f)$. Furthermore we want to apply:
- The bandpass signal $x(t)$ is said to result from the modulation of a low-frequency message signal $q(t)$ with the carrier signal $z(t)$ the frequency $f_{\rm T}$ . The type of modulation (whether analog or digital, amplitudes– or angle modulation, single sideband or double sideband) is not specified.
- The spectral function $X_+(f)$ of the corresponding analytical signal $x_+(t)$ exists only for positive frequencies and is twice as large as $X(f)$. For the derivation of $X_+(f)$ the carrier frequency $f_{\rm T}$ of the system does not need be known.
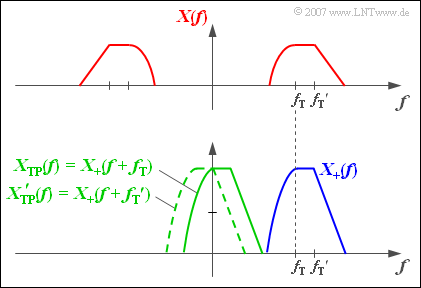
$\text{Definition:}$ If the spectrum of the analytical signal $x_+(t)$ is shifted to the left for $f_{\rm T}$ , the result is called the Spectrum of the Equivalent Low-Pass Signal:
- $$X_{\rm TP}(f) = X_{\rm +}(f + f_{\rm T}).$$
In general $X(f)$, $X_+(f)$ and $X_{\rm TP}(f)$ are complex-valued. However, if $X(f)$ is purely real, then the spectral functions $X_+(f)$ and $X_{\rm TP}(f)$ are also purely real, because they result from $X(f)$ only from the operations "Cut and Double" or "Frequency Shift" respectively.
}
For the calculation of the equivalent low-pass spectrum $X_{\rm TP}(f)$ - in contrast to $X_+(f)$ - the knowledge of the carrier frequency $f_{\rm T}$ is absolutely necessary. For other values of $f_{\rm T}$ other low-pass spectra will also result.
If one transforms the above equation into the time domain, one obtains after applying the shifting theorem:
- $$x_{\rm TP}(t) = x_{\rm +}(t)\cdot {\rm e}^{-{\rm j} \hspace{0.05cm}\cdot \hspace{0.05cm}2 \pi \cdot f_{\rm T}\cdot \hspace{0.05cm}t}.$$
The relation $x(t) = \text{Re}\big[x_+(t)\big]$ yields the procedure to determine the actual physical bandpass signal from the equivalent lowpass signal:
- $$x(t) = {\rm Re}[x_{\rm +}(t)] = {\rm Re}\big[x_{\rm TP}(t)\cdot {\rm e}^{\hspace{0.05cm}{\rm j} \hspace{0.05cm} \cdot 2\pi \hspace{0.05cm}\cdot\hspace{0.05cm} f_{\rm T}\hspace{0.05cm} \cdot \hspace{0.05cm} \hspace{0.05cm}t}\big].$$
$\text{Example 1:}$ The upper figure shows the purely real spectral function $X(f)$ of a bandpass signal $x(t)$ which is the result of modulating a low frequency signal $q(t)$ with the carrier frequency $f_{\rm T}$ .
Below that, the two likewise real spectral functions $X_+(f)$ and $X_{\rm TP}(f)$ are shown. Due to the asymmetries concerning the frequency origin $(f = 0)$ the corresponding time functions are complex.
- The continuous green spectral function $X_{\rm TP}(f)$ is shifted to the left with respect to $X_{+}(f)$ by the carrier frequency $f_{\rm T}$ .
- If the spectrum $X(f)$ is the modulation result of another message signal $q\hspace{0.05cm}'(t)$ with a different carrier frequency ${f_{\rm T} }\hspace{0.05cm}'$, this would also result in another equivalent TP signal ${X_{\rm TP} }\hspace{0.05cm}'(f)$.
- An exemplary spectral function ${X_{\rm TP} }\hspace{0.05cm}'(f)$ is drawn in the graphic with green-dashed lines.
Description in The Time Domain
To simplify the representation we now assume a line spectrum, so that the analytical signal can be represented as 'pointer compound ⇒ sum of complex rotating pointers:
- $$X_{+}(f) = \sum_{i=1}^{I} {A_i} \cdot {\rm e}^{-{\rm j}\hspace{0.05cm}\cdot \hspace{0.05cm} \varphi_i}\cdot\delta (f - f_i) \hspace{0.3cm}\bullet\!\!-\!\!\!-\!\!\!-\!\!\circ\, \hspace{0.3cm} x_{+}(t) = \sum_{i=1}^{I} A_i \cdot {\rm e}^{{\rm j}\hspace{0.05cm}\cdot \hspace{0.05cm}( 2 \pi \hspace{0.05cm}\cdot \hspace{0.05cm}f_i\hspace{0.05cm}\cdot \hspace{0.05cm} t \hspace{0.05cm}-\hspace{0.05cm} \varphi_i)}.$$
By shifting the frequency by $f_{\rm T}$ to the left the equivalent low pass signal in frequency and time domain is thus:
- $$X_{\rm TP}(f) = \sum_{i=1}^{I} {A_i} \cdot {\rm e}^{-{\rm j}\hspace{0.05cm}\cdot \hspace{0.05cm} \varphi_i}\cdot\delta (f - \nu_i)\hspace{0.3cm}\bullet\!\!-\!\!\!-\!\!\!-\!\!\circ\, \hspace{0.3cm} x_{\rm TP}(t) = \sum_{i=1}^{I} A_i \cdot {\rm e}^{{\rm j}\hspace{0.05cm}\cdot \hspace{0.05cm}( 2 \pi \hspace{0.05cm}\cdot \hspace{0.05cm} \nu_i \hspace{0.05cm}\cdot \hspace{0.05cm} t \hspace{0.05cm}-\hspace{0.05cm} \varphi_i)}.$$
The following relation is valid between the frequency values $f_i$ and $\nu_i$ $(i = 1, \ \text{...} \ , I)$:
- $$\nu_i = f_i - f_{\rm T} .$$
These equations can be interpreted as follows:
- At time $t = 0$ the equivalent low-pass signal is identical to the analytical signal:
- $$x_{\rm TP}(t = 0) = x_{\rm +}(t = 0)= \sum_{i=1}^{I} A_i \cdot {\rm e}^{{-\rm j}\hspace{0.05cm}\cdot \hspace{0.05cm} \varphi_i}.$$
- At this point in time, the pointer group is thus defined by the $I$ amplitude parameter $A_i$ and the $I$ phase positions $\varphi_i$ alone.
- All pointers of the analytical signal $x_+(t)$ rotate for $t > 0$ corresponding to the (always positive) frequencies $f_i$ counterclockwise.
- For the equivalent low-pass signal, the rotation speeds are lower. Hands with $\nu_i > 0$ turn in mathematically positive direction (counterclockwise), those with $\nu_i < 0$ in counterclockwise direction (clockwise).
- If the frequency parameter is $\nu_i = 0$ for a pointer, this pointer rests in the complex plane corresponding to its initial position.
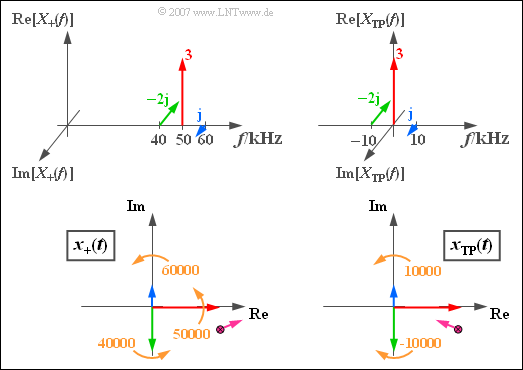
$\text{Example 2:}$ We consider a spectrum consisting of three spectral lines at $40\,\text{kHz}$, $50\,\text{kHz}$ and $60\,\text{kHz}$ consisting of spectrum $X_+(f)$. With the amplitude and phase parameters recognizable from the graphic you obtain the analytical signal $x_+(t)$ corresponding to the lower left sketch.
The snapshot of the lower left graph ⇒ analytical signal $x_+(t)$ applies to the time $t = 0$. All hands then turn counterclockwise at a constant angular velocity.
- The blue pointer rotates with $60000$ rotations per second are fastest and the green pointer rotates with the angular frequency $\omega_{40} = 2\pi \cdot 40000 \hspace{0.1cm} 1/\text{s}$ is the slowest.
- The violet sum point of all three pointers moves for $t > 0$ in the complex plane in a complicated manner, for the above numerical values first roughly in the direction drawn.
The graphics on the right describe the equivalent low-pass signal in the frequency domain (top) and in the time domain (bottom), valid for $f_{\rm T} = 50\,\text{kHz}$.
- The carrier is now at $f = 0$ and the corresponding red rotating pointer does not move.
- The blue pointer (OSB) rotates here with $\omega_{10} = 2\pi \cdot 10000 \hspace{0.1cm}1/\text{s}$ counterclockwise.
- The green pointer (USB) rotates counterclockwise at the same speed ($-\omega_{10}$).
Definition of The Locus Curve
$\text{Definition:}$ As locus curve we call the curve on which the equivalent low-pass signal $x_{\rm TP}(t)$ moves in the complex plane
Notes: In other technical literature this term is rarely used. Therefore, initially, an example is shown.
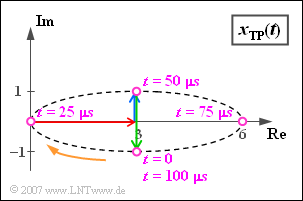
$\text{Example 3:}$ We consider the equivalent low-pass signal $x_{\rm TP}(t)$ of $\text{Example 2}$, consisting of
- the resting pointer of length $3$ (red)
- the pointer with $\omega_{10} = 2\pi \cdot 10000 \hspace{0.1cm} 1/\text{s}$ in mathematical positive direction rotating blue pointer with the complex amplitude j,
- the green pointer of length $2$, which is currently $t = 0$ in the direction of the negative imaginary axis. This rotates with the same angular velocity $\omega_{10}$ as the blue pointer, but in the opposite direction ($-\omega_{10}$).
The blue and the green pointer each require exactly one period duration $T_0 = 100 \,{\rm µ}\text{s}$ for one rotation. The further course of the process can be seen in the above illustration:
- The violet pointer sum is at time $t = 0$ equals $3 - \text{j}$.
- After $t = T_0/4 = 25 \,{\rm µ}\text{s}$ the resulting pointer group has the value „Null”, since now the two rotating pointers lie in the opposite direction to the carrier and compensate it exactly.
- After a period $(t = T_0 = 100 \,{\rm µ}\text{s})$ the initial state is reached again: $x_{\rm TP}(t = T_0) = x_{\rm TP}(t=0) = 3 - \text{j}$.
exactly.
- After a period $(t = T_0 = 100 \,{\rm µ}\text{s})$ the initial state is reached again: $x_{\rm TP}(t = T_0) = x_{\rm TP}(t=0) = 3 - \text{j}$.}}}
In this example the locus curve is an ellipse, which is traversed by the equivalent low pass signal once per period.
- The representation applies to the Double Sideband Amplitude Modulation with Carrier of a sinusoidal $10\ \rm kHz$ signal with a cosinusoidal carrier of any frequency, where the upper sideband (blue pointer) is attenuated.
- If the lengths of the blue and the green rotating pointer were equal, the locus curve would be a horizontal one on the real axis - see Task 4.5.
- In the book Modulation Methods the locus curves of different system variants are treated in detail.
In this example the locus curve is an ellipse, which is traversed by the equivalent low pass signal once per period.
- The representation applies to the Double-Sideband–Amplitude Modulation with Carrier of a sinusoidal $10\ \rm kHz$ signal with a cosinusoidal carrier of any frequency, where the upper sideband (blue pointer) is attenuated.
- If the lengths of the blue and the green rotating pointer were equal, the locus curve would be a horizontal one on the real axis - see Task 4.5.
- In the boo Modulation Methods ,the locus curves of different system variants are treated in detail.
Representing with Magnitude and Phase
The equivalent low-pass signal of the band-pass signal $x(t)$ is generally complex and can therefore be expressed in the form
- $$x_{\rm TP}(t) = a(t) \cdot {\rm e}^{{\rm j}\hspace{0.05cm}\cdot \hspace{0.05cm} \phi(t)}$$.
Note the plus sign in the argument of the exponential function, which differs from the Complex Fourier Series . This is because the equation with the positive sign for the phase is usually used to describe the modulation method for the physical signal as well:
- $$x(t) = a(t) \cdot {\cos} ( 2 \pi f_{\rm T} t + \phi(t)).$$
In many textbooks this equation is used with plus or minus signs depending on the application, but always with the same „phase identifier”. By using two different symbols $(\varphi$ and $\phi)$ we try to avoid this ambiguity in our learning tutorial $\rm LNTww$.
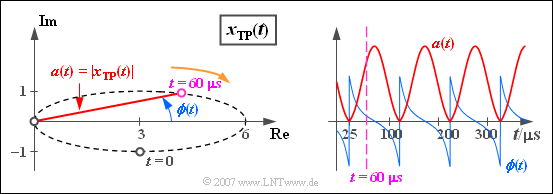
$\text{Example 4:}$ The same prerequisites apply as in the $\text{second example }$ and in the $\text{third one}$. InHowever, instead of the complex function $x_{\rm TP}(t)$ the two real functions $a(t)$ and $\phi(t)$ are now displayed in the graphic.
It should be noted that this is a representation:
- The Magnitude function shows the time dependence of the pointer length:
- $$a(t)= \vert x_{\rm TP}(t)\vert =\sqrt{ {\rm Re}\left[x_{\rm TP}(t)\right]^2 + {\rm Im}\left[x_{\rm TP}(t)\right]^2 }.$$
- The magnitude function $a(t)$ is in this example like the complex equivalent low pass signal $x_{\rm TP}(t)$ periodic with $T_0$ and takes values between $0$ and $6$ .
- Die Phasenfunktion beschreibt den zeitabhängigen Winkel des äquivalenten Tiefpass-Signals $x_{\rm TP}(t)$, bezogen auf den Koordinatenursprung:
- $$\phi(t)= {\rm arc} \left[x_{\rm TP}(t)\right]= {\rm arctan} \hspace{0.1cm}\frac{ {\rm Im}\left[x_{\rm TP}(t)\right]}{ {\rm Re}\left[x_{\rm TP}(t)\right]}.$$
Hier noch einige numerische Ergebnisse für die Phasenwerte:
- Die Phase im Startzeitpunkt ist $\phi (t = 0) =\hspace{0.1cm} -\arctan (1/3) ≈ \hspace{0.1cm} -18.43^{\circ} = \hspace{0.1cm}-0.32\,\text{rad}$.
- Bei $t = 25\,{\rm µ}\text{s}$ sowie zu allen äquidistanten Zeiten davon im Abstand $T_0 = 100 \,{\rm µ}\text{s}$ ist $x_{\rm TP}(t) = 0$, so dass zu diesen Zeitpunkten die Phase $\phi(t)$ sprungartig von $-\pi /2$ auf $+\pi /2$ wechselt.
- Zum violett eingezeichneten Zeitpunkt $t = 60\,{\rm µ}\text{s}$ hat die Phase einen leicht positiven Wert.
Zusammenhang zwischen äquivalentem TP-Signal und BP-Signal
Ein bandpassartiges Signal $x(t)$, das sich aus der Modulation eines niederfrequenten Nachrichtensignals $q(t)$ mit einem Trägersignal $z(t)$ der Frequenz $f_{\rm T}$ ergeben hat, kann wie folgt dargestellt werden:
- $$x(t) = a(t) \cdot {\cos} ( 2 \pi f_{\rm T} t + \phi(t)) \hspace{0.3cm}\Rightarrow\hspace{0.3cm} x_{\rm TP}(t) = a(t) \cdot {\rm e}^{{\rm j}\hspace{0.05cm}\cdot \hspace{0.05cm} \phi(t)}.$$
Hierzu ist anzumerken:
- $a(t)$ ist die zeitabhängige Amplitude, die man oft auch als Hüllkurve bezeichnet. Diese ist gleich dem Betrag $|x_{\rm TP}(t)|$ des äquivalenten Tiefpass–Signals.
- $\phi(t)$ ist die Phasenfunktion, also die zeitabhängige Phase, die ebenfalls aus dem äquivalenten Tiefpass–Signal als der Winkel zum Koordinatenursprung der komplexen Ebene ermittelt werden kann.
- Im physikalischen Signal $x(t)$ erkennt man die Phase $\phi(t)$ an den Nulldurchgängen. Bei $\phi(t) > 0$ tritt der Nulldurchgang in $x(t)$ im Bereich der Zeit $t$ früher auf als beim Trägersignal $z(t)$. Dagegen bedeutet $\phi(t) < 0$ eine Verschiebung des Nulldurchgangs auf einen späteren Zeitpunkt.
- Man spricht von Amplitudenmodulation, wenn die gesamte Information über das Nachrichtensignal in der Hüllkurve $a(t)$ steckt, während $\phi(t)$ konstant ist.
- Dagegen beinhaltet bei Phasenmodulation die Phasenfunktion $\phi(t)$ die gesamte Information über das Nachrichtensignal, während $a(t)$ konstant ist.
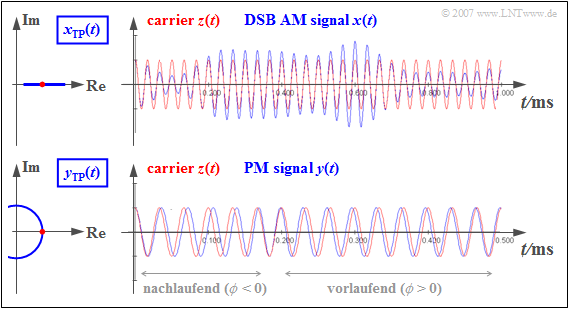
$\text{Beispiel 5:}$ Der obere Teil der folgenden Grafik beschreibt die Zweiseitenband–Amplitudenmodulation (ZSB-AM) mit Träger:
- Das äquivalente TP–Signal $x_{\rm TP}(t)$ ist hier stets reell ⇒ die Ortskurve ist eine horizontale Gerade.
- Deshalb stimmen die Nulldurchgänge des blauen ZSB–AM–Signals $x(t)$ mit denen des roten Trägersignals $z(t)$ exakt überein.
- Das heißt: Die Phasenfunktion $\phi(t)$ ist identisch Null ⇒ die Hüllkurve $a(t)$ beinhaltet die gesamte Information über das Nachrichtensignal.
Der untere Grafikteil gilt dagegen für die Phasenmodulation (PM):
- Das PM-Signal $y(t)$ hat stets eine konstante Einhüllende ⇒ die Ortskurve ist ein Kreisbogen.
- Der Phasenwert ist hier zunächst kleiner Null ⇒ die $y(t)$–Nulldurchgänge treten später auf als die des Trägers $z(t)$ ⇒ die Nulldurchgänge sind „nachlaufend”.
- Bei positiven Werten des Nachrichtensignals gilt auch $\phi (t) > 0$ ⇒ die Nulldurchgänge treten früher auf als beim Trägersignal ⇒ sie sind „vorlaufend”.
- Bei Phasenmodulation steckt also die gesamte Information über das Nachrichtensignal $q(t)$ in den Lagen der Nulldurchgänge.
Warum gibt es für das gleiche Signal drei Darstellungsformen?
Abschließend – hoffentlich nicht zu spät – wollen wir uns noch der Frage zuwenden, warum die beiden komplexen und im Verständnis komplizierteren Signale $x_+(t)$ und $x_{\rm TP}(t)$ zur Beschreibung des tatsächlichen Bandpass–Signals $x(t)$ eigentlich notwendig sind. Sie wurden nicht deshalb in der Nachrichtentechnik eingeführt, um Studierende zu verunsichern, sondern:
$\text{Fazit:}$
- Die Hüllkurve $a(t)$ und die Phasenfunktion $\phi (t)$ können aus dem tatsächlichen, physikalischen BP–Signal $x(t)$ nur in einigen Sonderfällen direkt und in einfacher Weise extrahiert werden.
- Das real nicht existierende äquivalente Tiefpass–Signal $x_{\rm TP}(t)$ ist ein mathematisches Hilfsmittel, mit dem die Zeitverläufe $a(t)$ und $\phi (t)$ durch einfache geometrische Überlegungen bestimmt werden können. Im Buch Modulation Methods werden wir darauf zurückkommen.
- Das analytische Signal $x_+(t)$ ist ein Zwischenschritt beim Übergang von $x(t)$ auf $x_{\rm TP}(t)$. Während $x_+(t)$ stets komplex ist, kann $x_{\rm TP}(t)$ in Sonderfällen reell sein, zum Beispiel bei idealer Amplitudenmodulation entsprechend dem Kapitel Zweiseitenband-Amplitudenmodulation (ZSB-AM).
Es gilt das gleiche Prinzip wie häufig in den Naturwissenschaften und Technik:
- Die Einführung von $x_+(t)$ und $x_{\rm TP}(t)$ bringt für einfache Probleme eher eine Verkomplizierung.
- Deren Vorteile erkennt man erst bei schwierigeren Aufgabenstellungen, die allein mit dem physikalischen Bandpass-Signal $x(t)$ nicht gelöst werden könnten oder nur mit sehr viel größerem Aufwand.
Zur weiteren Verdeutlichung stellen wir noch zwei interaktive Applets bereit:
- Physikalisches Signal & AnalytischesSignal ⇒ „Zeigerdiagramm”,
- Physikalisches Signal & Äquivalentes TP-Signal ⇒ „Ortskurve”.
Darstellung nach Real- und Imaginärteil
Insbesondere zur Beschreibung der Quadratur-Amplitudenmodulation (QAM) eignet sich die Darstellung des äquivalenten Tiefpass–Signals nach Real– und Imaginärteil:
- $$x_{\rm TP}(t) = x_{\rm I}(t)+ {\rm j} \cdot x_{\rm Q}(t).$$
In dieser Darstellung bezeichnet
- der Realteil $x_{\rm I}(t)$ die Inphasekomponente (Normalkomponente),
- der Imaginärteil $x_{\rm Q}(t)$ die Quadraturkomponente
von $x_{\rm TP}(t)$. Mit der Betragsfunktion $a(t) = |x_{\rm TP}(t)|$ und der Phasenfunktion $\phi (t) = \text{arc}\,x_{\rm TP}(t)$ entsprechend den Definitionen auf den vorangegangenen Seiten gilt:
- $$\begin{align*}x_{\rm I}(t) & = {\rm Re}[x_{\rm TP}(t)] = a(t) \cdot \cos (\phi(t)),\\ x_{\rm Q}(t) & = {\rm Im}[x_{\rm TP}(t)] = a(t) \cdot \sin (\phi(t)).\end{align*}$$
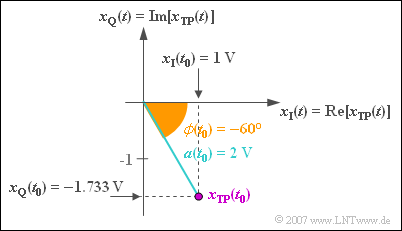
$\text{Beispiel 6:}$ Zum betrachteten Zeitpunkt $t_0$ gilt für das äquivalente Tiefpass–Signal:
- $$x_{\rm TP}(t = t_0) = 2\,{\rm V} \cdot {\rm e}^{- {\rm j \hspace{0.05cm}\cdot \hspace{0.05cm} 60 ^\circ} }.$$
Mit dem Satz von Euler kann hierfür geschrieben werden:
- $$x_{\rm TP}(t = t_0) = 2\,{\rm V} \cdot \cos(60 ^\circ) - {\rm j} \cdot 2\,{\rm V} \cdot \sin(60 ^\circ).$$
Damit gilt für die Inphasekomponente und für die Quadraturkomponente:
- $$x_{\rm I}(t = t_0) = 2\,{\rm V} \cdot \cos(60 ^\circ) = 1\text{V}, $$
- $$x_{\rm Q}(t = t_0) = \hspace{0.05cm} - {\rm j} \cdot 2\,{\rm V} \cdot \sin(60^\circ) =\hspace{0.05cm}-1.733\text{V}.$$
Durch Anwendung trigonometrischer Umformungen kann gezeigt werden, dass man das reelle, physikalische Bandpass–Signal auch in folgender Weise darstellen kann:
- $$x(t) = a(t) \cdot \cos (2 \pi \cdot f_{\rm T} \cdot t + \phi(t)) = x_{\rm I}(t)\cdot \cos (2 \pi \cdot f_{\rm T} \cdot t )-x_{\rm Q}(t)\cdot \sin (2 \pi \cdot f_{\rm T} \cdot t ). $$
Das Minuszeichen ergibt sich wegen der Verwendung der Phasenfunktion $\phi (t)$. Ein Vergleich mit der Seite Darstellung mit Cosinus- und Sinusanteil im zweiten Hauptkapitel zeigt, dass sich anstelle der Differenz die Summe ergibt, wenn man sich auf $\varphi (t) = -\phi (t)$ bezieht. Angepasst auf unser Beispiel erhält man dann:
- $$x(t) = a(t) \cdot \cos (2 \pi \cdot f_{\rm T} \cdot t - \varphi(t)) = x_{\rm I}(t)\cdot \cos (2 \pi \cdot f_{\rm T} \cdot t )+x_{\rm Q}(t)\cdot \sin (2 \pi \cdot f_{\rm T} \cdot t ).$$
Die Quadraturkomponente $x_{\rm Q}(t)$ unterscheidet sich gegenüber der oberen Gleichung also im Vorzeichen.
Ermittlung des äquivalenten TP-Signals aus dem BP-Signal
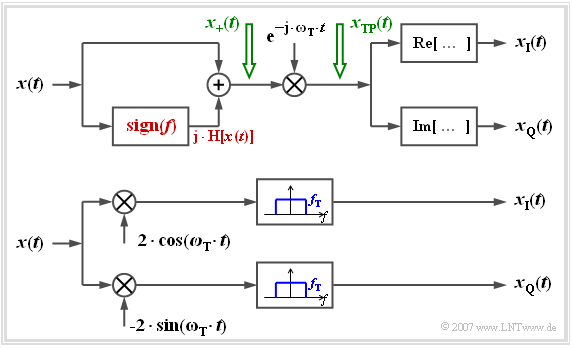
Die folgende Grafik zeigt zwei Anordnungen, um aus dem reellen Bandpass–Signal $x(t)$ das komplexe Tiefpass–Signal aufgespalten nach Inphase– und Quadraturkomponente zu ermitteln, beispielsweise zur Darstellung auf einem Oszilloskop. Betrachten wir zuerst das obere Modell:
- Hier wird zunächst das analytische Signal $x_+(t)$ durch Hinzufügen der Hilberttransformierten erzeugt.
- Durch Multiplikation mit der komplexen Exponentialfunktion (mit negativem Exponenten!) kommt man zum äquivalenten Tiefpass–Signal $x_{\rm TP}(t)$.
- Die gesuchten Komponenten $x_{\rm I}(t)$ und $x_{\rm Q}(t)$ erhält man dann durch Real– bzw. Imaginärteilbildung.
Bei der unteren (praxisrelevanteren) Anordnung erhält man für den oberen bzw. unteren Zweig nach den jeweiligen Multiplikationen:
- $$a(t)\cdot \cos (\omega_{\rm T} \cdot t + \phi(t)) \cdot 2 \cdot \cos (\omega_{\rm T} \cdot t ) = a(t)\cdot \cos ( \phi(t)) + \varepsilon_{\rm oben}(t),$$
- $$a(t)\cdot \cos (\omega_{\rm T} \cdot t + \phi(t)) \cdot (-2) \cdot \sin (\omega_{\rm T} \cdot t ) = a(t)\cdot \sin ( \phi(t)) + \varepsilon_{\rm unten}(t)).$$
Die jeweils zweiten Anteile liegen im Bereich um die doppelte Trägerfrequenz und werden durch die Tiefpässe mit jeweiliger Grenzfrequenz $f_{\rm T}$ entfernt:
- $$\varepsilon_{\rm oben}(t) = a(t)\cdot \cos (2\omega_{\rm T} \cdot t + \phi(t)),\hspace{0.8cm} \varepsilon_{\rm unten}(t) = - a(t)\cdot \sin (2\omega_{\rm T} \cdot t + \phi(t)).$$
Ein Vergleich mit obigen Gleichungen zeigt, dass am Ausgang die gewünschten Komponenten $x_{\rm I}(t)$ und $x_{\rm Q}(t)$ abgegriffen werden können:
- $$x_{\rm I}(t) = a(t)\cdot \cos ( \phi(t)) ,$$
- $$x_{\rm Q}(t) = a(t)\cdot \sin ( \phi(t)) .$$
Leistung und Energie eines Bandpass-Signals
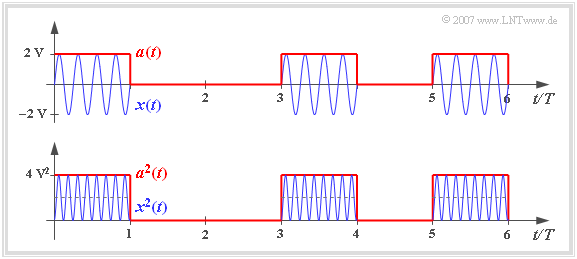
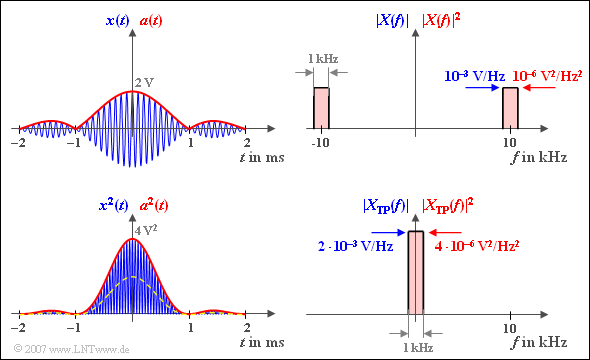
Wir betrachten das (blaue) Bandpass-Signal $x(t)$ gemäß der Grafik, das sich zum Beispiel bei Binary Amplitude Shift Keying ergibt. Dieses digitale Modulationsverfahren ist auch bekannt unter dem Namen On–Off–Keying.
Die auf $1 \,\Omega$ bezogene Signalleistung ergibt sich nach den Ausführungen auf der Seite Energiebegrenzte und leistungsbegrenzte Signale zu
- $$P_x = \lim_{T_{\rm M} \to \infty} \frac{1}{T_{\rm M}} \cdot \int^{+T_{\rm M}/2} _{-T_{\rm M}/2}\hspace{-0.1cm} x^2(t)\,{\rm d}t.$$
Sind die binären Nullen und Einsen gleichwahrscheinlich, so kann man auf den unendlichen Integrationsbereich und den Grenzübergang verzichten, und man erhält für das oben skizzierte Mustersignal $x(t)$:
- $$P_x = \frac{1}{2T} \cdot \int ^{2T} _{0} x^2(t)\,{\rm d}t = \frac{4\,{\rm V}^2}{2T} \cdot \int^{T} _{0} \cos^2(\omega_{\rm T} \cdot t)\,{\rm d}t= 1\,{\rm V}^2.$$
Aus der unteren Skizze ist zu erkennen, dass man durch Mittelung über die quadrierte Hüllkurve $a^2(t)$ – also über das Betragsquadrat des äquivalenten Tiefpass–Signals $x_{\rm TP}(t)$ – ein doppelt so großes Ergebnis erhält. Deshalb gilt in gleicher Weise:
- $$P_x = { {1}/{2} \hspace{0.08cm}\cdot }\lim_{T_{\rm M} \to \infty} \frac{1}{T_{\rm M}} \cdot \int^{T_{\rm M}/2} _{-T_{\rm M}/2} |x_{\rm TP}(t)|^2\,{\rm d}t = {{1}/{2} \hspace{0.08cm}\cdot }\lim_{T_{\rm M} \to \infty} \frac{1}{T_{\rm M}} \cdot \int^{T_{\rm M}/2} _{-T_{\rm M}/2} a^2(t)\,{\rm d}t.$$
Dieses Resultat lässt sich verallgemeinern und es auch auf energiebegrenzte Signale anwenden. In diesem Fall gilt für die Energie entsprechend der Seite Energiebegrenzte und leistungsbegrenzte Signale:
- $$E_x = \int ^{+\infty} _{-\infty} x^2(t)\,{\rm d}t = { {1}/{2} \hspace{0.08cm}\cdot }\int ^{+\infty} _{-\infty} |x_{\rm TP}(t)|^2\,{\rm d}t = { {1}/{2} \hspace{0.08cm}\cdot }\int ^{+\infty} _{-\infty} a^2(t)\,{\rm d}t.$$
Diese Gleichung gilt allerdings nur dann exakt, wenn die Trägerfrequenz $f_{\rm T}$ sehr viel größer als die Bandbreite $B_{\rm BP}$ des Bandpasses ist.
$\text{Beispiel 7:}$ Wir betrachten das in der Grafik links oben blau skizzierte Bandpass–Signal $x(t)$ mit $A = 2\,\text{V}$, $B = 1\,\text{kHz}$ und $f_{\rm T} = 10\,\text{kHz}$:
- $$x(t) = A \cdot {\rm si}(\pi \cdot B \cdot t) \cdot \cos(2 \pi \cdot f_{\rm T}\cdot \hspace{0.05cm}t + \phi(t)).$$
Oben rechts ist das zum Signal $x(t)$ gehörige Betragsspektrum $\vert X(f) \vert$ dargestellt. Es gilt die blaue Beschriftung:
- $X(f)$ ist aufgrund der Symmetrieverhältnisse rein reell:
- $$\vert X(f) \vert = X(f).$$
- $\vert X(f) \vert$ setzt sich also aus zwei Rechtecken um $\pm f_{\rm T}$ zusammen.
- Im Bereich um die Trägerfrequenz gilt:
- $$\vert X(f) \vert = A/(2B) = 10^{-3}\text{V/Hz}.$$
Die Energie dieses Bandpass–Signals könnte prinzipiell nach folgender Gleichung berechnet werden:
- $$E_x = \int^{+\infty} _{-\infty} A^2 \cdot \frac{ {\rm sin}^2(\pi \cdot B \cdot t)}{ (\pi \cdot B \cdot t)^2}\cdot \cos^2(2 \pi \cdot f_{\rm T}\cdot \hspace{0.05cm}t + \phi(t))\,{\rm d}t .$$
Entsprechend den obigen Gleichungen gilt mit der oben links rot eingezeichneten Hüllkurve $a(t)$ aber auch:
- $$E_x = { {1}/{2} \hspace{0.08cm}\cdot }\int^{+\infty} _{-\infty} a^2(t)\,{\rm d}t= { {1}/{2} \hspace{0.08cm}\cdot }\int^{+\infty} _{-\infty} \vert A \cdot {\rm si}(\pi \cdot B \cdot t)\vert^2\,{\rm d}t $$
- $$\Rightarrow \hspace{0.3cm} E_x = A^2\cdot \int^{+\infty} _{0} {\rm si}^2(\pi \cdot B \cdot t)\,{\rm d}t =A^2\cdot \frac {\pi}{2}\cdot \frac {1}{\pi B} = \frac {A^2}{2 B}= 2 \cdot 10^{-3}\,{\rm V}^2/{\rm Hz}.$$
Aus dieser Gleichung erkennt man sofort, dass die Signalenergie $E_x$ unabhängig von der Trägerphase $\phi$ ist.
Eine zweite Lösungsmöglichkeit mit gleichem Ergebnis bietet schließlich der Satz von Parseval:
- $$\int ^{+\infty} _{-\infty} a^2(t)\,{\rm d}t= \int ^{+\infty} _{-\infty} \vert A(f) \vert ^2\,{\rm d}f \hspace{0.3cm} \Rightarrow \hspace{0.3cm} E_x = {1}/{2}\cdot ( {A}/{B})^2 \cdot B = {A^2}/(2 B).$$
Hierbei ist berücksichtigt:
- Es gilt $\vert A(f) \vert = \vert X_{\rm TP}(f) \vert $.
- Innerhalb der Bandbreite $B$ um die Frequenz $f = 0$ ist $X_{\rm TP}(f)$ doppelt so groß wie $X(f)$ um die Frequenz $f = f_{\rm T}$, nämlich $A/B$.
- Dies hängt mit der Definition des Spektrums $X_+(f)$ des analtischen Signals zusammen, aus dem $X_{\rm TP}(f)$ durch Verschiebung entsteht.
Exercises for The Chapter
Exercise 4.5: Locus Curve for DSB-AM
Exercise 4.5Z: Simple Phase Modulator
Exercise 4.6: Loot Curve for ESB-AM
Exercise 4.6Z: Loot Curve for Phase Modulation

