Cross-Correlation Function and Cross Power-Spectral Density
Contents
Definition of the cross-correlation function
In many engineering applications, one is interested in a quantitative measure to describe the statistical relatedness between different processes or between their pattern signals. One such measure is the "cross-correlation function", which is given here under the assumptions of "stationarity"' and "ergodicity".
$\text{Definition:}$ For the cross-correlation function $\rm (CCF)$ of two stationary and ergodic processes with the pattern functions $x(t)$ and $y(t)$ holds:
- $$\varphi_{xy}(\tau)={\rm E} \big[{x(t)\cdot y(t+\tau)}\big]=\lim_{T_{\rm M}\to\infty}\,\frac{1}{T_{\rm M} }\cdot\int^{T_{\rm M}/{\rm 2} }_{-T_{\rm M}/{\rm 2} }x(t)\cdot y(t+\tau)\,\rm d \it t.$$
- The first defining equation characterizes the expected value formation ("ensemble averaging"),
- while the second equation describes the "time averaging" over an (as large as possible) measurement period $T_{\rm M}$.
A comparison with the ACF definition shows many similarities.
- Setting $y(t) = x(t)$, we get $φ_{xy}(τ) = φ_{xx}(τ)$, i.e., the auto-correlation function,
- for which, however, in our tutorial we mostly use the simplified notation $φ_x(τ)$.
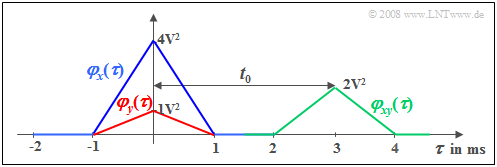
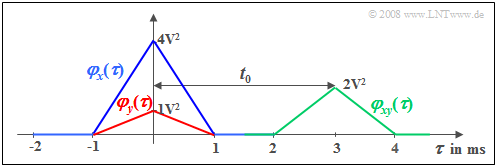
$\text{Example 1:}$ We consider a random signal $x(t)$ with triangular auto-correlation function $φ_x(τ)$ ⇒ blue curve. This ACF shape results e.g. for
- a binary signal with equally probable bipolar amplitude coefficients $(\pm1)$
- and a rectangular basic pulse $g(t)$.
We consider a second signal $y(t) = \alpha \cdot x (t - t_{\rm 0})$, which differs from $x(t)$ only by an attenuation factor $(α =0.5)$ and a delay time $(t_0 = 3 \ \rm ms)$.
This attenuated and shifted signal has the auto-correlation function drawn in red:
- $$\varphi_{y}(\tau) = \alpha^2 \cdot \varphi_{x}(\tau) .$$
The shift around $t_0$ is not seen in this auto-correlation function in contrast to the (green) cross-correlation function $\rm (CCF)$ for which the following relation holds:
- $$\varphi_{xy}(\tau) = \alpha \cdot \varphi_{x}(\tau- t_{\rm 0}) .$$
Properties of the cross-correlation function
In the following, essential properties of the cross-correlation function $\rm (CCF)$ are composed. Important differences to the auto-correlation function $\rm (ACF)$ are:
- The formation of the cross-correlation function is »not commutative«. Rather, there are always two distinct functions, viz.
- $$\varphi_{xy}(\tau)={\rm E} \big[{x(t)\cdot y(t+\tau)}\big]=\lim_{T_{\rm M}\to\infty}\,\frac{1}{T_{\rm M}}\cdot\int^{T_{\rm M}/{\rm 2}}_{-T_{\rm M}/{\rm 2}}x(t)\cdot y(t+\tau)\,\, \rm d \it t,$$
- $$\varphi_{yx}(\tau)={\rm E} \big[{y(t)\cdot x(t+\tau)}\big]=\lim_{T_{\rm M}\to\infty}\,\frac{1}{T_{\rm M}}\cdot\int^{T_{\rm M}/{\rm 2}}_{-T_{\rm M}/{\rm 2}}y(t)\cdot x(t+\tau)\,\, \rm d \it t .$$
- There is a relationship between the two functions: $φ_{yx}(τ) = φ_{xy}(-τ)$. In $\text{Example 1}$ of the last section, the second cross-correlation function $φ_{yx}(τ)$ would have its maximum at $τ = -3 \ \rm ms$.
- In general, the »maximum CCF« does not occur at $τ = 0$ $($exception: $y = α \cdot x)$ and the CCF value $φ_{xy}(τ = 0)$ does not have any special, physically interpretable meaning as in the ACF, where this value reflects the process power.
- For all $τ$-values, the »CCF magnitude« is less than or equal to the geometric mean of the two signal powers according to the Cauchy-Schwarz inequality:
- $$\varphi_{xy}( \tau) \le \sqrt {\varphi_{x}( \tau = 0) \cdot \varphi_{y}( \tau = 0)}.$$
- In $\text{Example 1}$ on the last page, the equal sign applies: $\varphi_{xy}( \tau = t_{\rm 0}) = \sqrt {\varphi_{x}( \tau = 0) \cdot \varphi_{y}( \tau = 0)} = \alpha \cdot \varphi_{x}( \tau = {\rm 0}) .$
- If $x(t)$ and $y(t)$ do not contain a common periodic fraction, the »CCF limit« for $τ → ∞$ gives the product of both means:
- $$\lim_{\tau \rightarrow \infty} \varphi _{xy} ( \tau ) = m_x \cdot m_y .$$
- If two signals $x(t)$ and $y(t)$ are »uncorrelated«, then $φ_{xy}(τ) ≡ 0$, that is, it is $φ_{xy}(τ) = 0$ for all values of $τ$. For example, this assumption is justified in most cases when considering a useful signal and a noise signal together.
- However, it should always be noted, that the CCF includes only the »linear statistical bindings« between the signals $x(t)$ and $y(t)$. Bindings of other types – such as for the case $y(t) = x^2(t)$ – are not taken into account in the CCF formation.
Applications of the cross-correlation function
The applications of the cross-correlation function in Communication systems are many. Here are some examples:
$\text{Example 2:}$ In amplitude modulation, but also in BPSK systems ("Binary Phase Shift Keying"), the so-called Synchronous Demodulator is often used for demodulation (resetting the signal to the original frequency range), whereby a carrier signal must also be added at the receiver, and this must be frequency and phase synchronous to the transmitter.
⇒ If one forms the CCF between the received signal $r(t)$ and the carrier signal $z_{\rm E}(t)$ on the receiver side, the phase synchronous position between the two signals can be recognized by means of the CCF peak, and it can be readjusted in case of drifting apart.
$\text{Example 3:}$ The multiple access method CDMA ("Code Division Multiple Access") is used, for example, in the mobile radio standard UMTS. It requires strict phase synchronism, with respect to the added "pseudonoise sequences" at the transmitter ("band spreading") and at the receiver ("band compression").
⇒ This synchronization problem is also usually solved using the cross-correlation function.
$\text{Example 4:}$ The CCF can be used to determine whether or not a known signal $s(t)$ is present in a noisy received signal $r(t) = α - s(t - t_0) + n(t)$ and if so, at what time $t_0$ it occurs.
- From the calculated $t_0$ value, for example, a driving speed can be determined ("radar technique").
- This task can also be solved with the "matched filter", which has many similarities with the CCF and is described in a later chapter.
$\text{Example 5:}$ In the so-called "correlation receiver", one uses the CCF for signal detection. Here one forms the cross-correlation function
- between the received signal $r(t)$ $($distorted by noise and possibly also by distortions$)$
- and all possible transmitted signals $s_i(t)$, where for the control index $i = 1$, ... , $I$ shall hold.
⇒ Deciding $N$ binary symbols together, then $I = {\rm 2}^N$. One then decides on the symbol sequence with the largest CCF value, achieving the minimum error probability according to the "maximum likelihood decision rule".
Cross power-spectral density
For some applications it can be quite advantageous to describe the correlation between two random signals in the frequency domain.
$\text{Definition:}$
The two cross power-spectral densities ${\it Φ}_{xy}(f)$ and ${\it Φ}_{yx}(f)$ result from the corresponding cross-correlation functions $\varphi_{xy}({\it \tau})$, resp. $\varphi_{yx}({\it \tau})$ by Fourier transform:
- $${\it \Phi}_{xy}(f)=\int^{+\infty}_{-\infty}\varphi_{xy}({\it \tau}) \cdot {\rm e}^{ {\rm -j}\pi f \tau} \rm d \it \tau, $$
- $${\it \Phi}_{yx}(f)=\int^{+\infty}_{-\infty}\varphi_{yx}({\it \tau}) \cdot {\rm e}^{ {\rm -j}\pi f \tau} \rm d \it \tau.$$
The same relationship applies here as between
- a deterministic signal $x(t)$ and its spectrum $X(f)$,
- the auto-correlation function ${\it φ}_x(τ)$ of an ergodic process $\{x_i(t)\}$ and the corresponding power-spectral density ${\it Φ}_x(f)$.
Similarly, the Inverse Fourier transform ⇒ "Second Fourier integral" describes here the transition from the frequency domain to the time domain.
$\text{Example 6:}$ We refer to $\text{Example 1}$
- with the rectangular random variable $x(t)$
- and the attenuated and shifted signal $y(t) = α - x(t - t_0)$.
⇒ Since the auto-correlation function ${\it φ}_x(τ)$ is triangular, the power-spectral density ${\it Φ}_x(f)$ has a ${\rm sinc}^2$-shaped profile.
In general, what statements can we derive from this graph for the spectral functions?
- In $\text{Example 1}$ we found that the autocorrelation function ${\it φ}_y(τ)$ differs from ${\it φ}_x(τ)$ only by the constant factor $α^2$.
- It is clear that the power-spectral density ${\it Φ}_y(f)$ differs from ${\it \Phi}_x(f)$ also only by this constant factor $α^2$. Both spectral functions are real.
- In contrast, the cross power-spectral density has a complex functional:
- $${\it \Phi}_{xy}(f) ={\it \Phi}^\star_{yx}(f)= \alpha \cdot {\it \Phi}_{x}(f) \hspace{0.05cm}\cdot {\rm e}^{- {\rm j } \hspace{0.02cm}\pi f t_0}.$$
Exercises for the chapter
Exercise 4.14: ACF and CCF for Square Wave Signals
Exercise 4.14Z: Echo Detection

