Exercise 2.2: Distortion Power
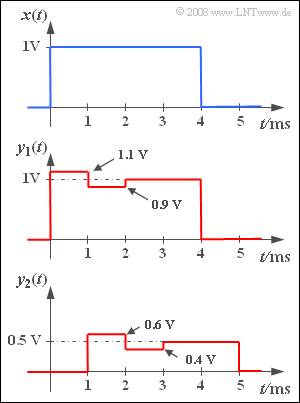
A rectangular pulse $x(t)$ with amplitude $1 \hspace{0.08cm} \rm V$ and duration $4 \hspace{0.08cm} \rm ms$ is applied to the input of a communication system. Then, the pulse $y_1(t)$ , whose signal parameters can be taken from the middle sketch, is measured at the system output.
At the output of another system $S_2$ , the signal $y_2(t)$ shown in the lower sketch is obtained with the same input signal $x(t)$ .
Let the following definition apply to the error signal used in this task:
- $$\varepsilon(t) = y(t) - \alpha \cdot x(t - \tau) .$$
The parameters $\alpha$ and $\tau$ are to be determined such that the distortion power (the mean squared error) is minimal. For this, the following holds:
- $$P_{\rm V} = \overline{\varepsilon^2(t)} = \frac{1}{T_{\rm M}} \cdot \int\limits_{ ( T_{\rm M})} {\varepsilon^2(t) }\hspace{0.1cm}{\rm d}t$$
These definitions already take into account that a frequency-independent damping just as a runtime which is constant for all frequencies does not contribute to the distortion.
The integration interval has to be chosen appropriately in each case:
- Use the interval $0$ ... $4 \hspace{0.08cm} \rm ms$ for $y_1(t)$ and the interval $1 \hspace{0.08cm} {\rm ms}$ ... $5 \hspace{0.08cm} \rm ms$ for $y_2(t)$ .
- Thus, the measurement time is $T_{\rm M} = 4 \hspace{0.08cm} \rm ms$ in both cases.
- It is obvious that with respect to $y_1(t)$ the parameters $\alpha = 1$ and $\tau = 0$ respectively result in the minimum distortion power.
In general, the so-called signal–to–distortion–power ratio is given by the following formula
- $$\rho_{\rm V} = \frac{ \alpha^2 \cdot P_{x}}{P_{\rm V}} \hspace{0.05cm}.$$
Here,
- $P_x$ denotes the power of the signal $x(t)$, and
- $\alpha^2 \cdot P_x$ denotes the power of $y(t) = \alpha \cdot x(t - \tau)$, that would arise as aresult in the absence of distortion.
Usually, – as also in this task– this S/N-ratio $\rho_{\rm V}$ is given logarithmically in $\rm dB$ .
Please note:
- The exercise belongs to the chapter Classification of the Distortions.
- In particular, consider the pages
Questions
Solution
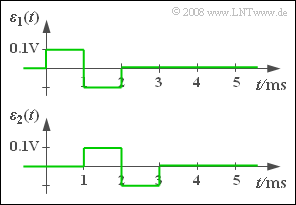
(1) The error signal $\varepsilon_1(t)$ shown in the graph is obtained with the given parameters $\alpha = 1$ and $\tau= 0$ . The distortion power is thus equal to:
- $$P_{\rm V1} = \frac{ {1 \, \rm ms}}{4 \, \rm ms} \cdot \big[ ({0.1 \, \rm V})^2 + ({-0.1 \, \rm V})^2\big]\hspace{0.3cm}\Rightarrow \hspace{0.3cm}P_{\rm V1} \hspace{0.15cm}\underline{ = 5 \cdot 10^{-3} \, \rm V^2}. $$
(2) The power of the input signal is:
- $$P_{x} = \frac{1}{4 \, \rm ms} \cdot ({1 \, \rm V})^2 \cdot {4 \, \rm ms}\hspace{0.15cm}{ = {1 \, \rm V^2}}.$$
- The following is obtained for the signal–to–distortion–power ratio with the result from (1) :
$$\rho_{\rm V1} = \frac{ P_{x}}{P_{\rm V1}}= \frac{ {1 \, \rm V^2}}{0.005 \, \rm V^2}\hspace{0.05cm}\rm = 200\hspace{0.3cm} \Rightarrow \hspace{0.3cm} 10 \cdot {\rm lg}\hspace{0.1cm}\rho_{\rm V1}\hspace{0.15cm}\underline{ = {23.01 \, \rm dB}}.$$
(3) The sketch on the information sheet makes it clear that even without the distortions occuring – but due to attenuation and runtime alone – the signal $y(t)$ would differ significantly from $x(t)$ .
- The following would arise as a result: $y(t) = 0.5 \cdot x(t-1\ {\rm ms}) $ .
- If someone does not immediately perceive these values from the graph, then first the error signal
- $$\varepsilon_2(t) = y_2(t) - \alpha \cdot x(t - \tau)$$
- and afterwards the mean squared error for very (infinitely) many $\alpha$– and $\tau$–values would have to be determined, in doing so the integration interval is to be adjusted to $\tau$ in each case.
- Then, the smallest possible result would also be obtained for $\alpha \; \underline{= 0.5}$ and $\tau \; \underline{= 1 \ \rm ms}$ . However, for this optimization of $\alpha$ and $\tau$ the useage of a computer program should be granted.
(4) The above sketch shows that $\varepsilon_2(t)$ is equal to the error signal $\varepsilon_1(t)$ except for a shift by $1 \ \rm ms$ . Considering the integration interval $1 \ {\rm ms}$ ... $5 \ {\rm ms}$ the same distortion power is obtained:
- $$P_{\rm V2} = P_{\rm V1} \hspace{0.15cm}\underline{ = 5 \cdot 10^{-3} \, \rm V^2}.$$
(5) According to the information sheet the following holds:
- $$\rho_{\rm V2} = \frac{ \alpha^2 \cdot P_{x}}{P_{\rm V2}}= \frac{ 0.5^2 \cdot {1 \, \rm V^2}}{0.005 \, \rm V^2}\hspace{0.05cm}\rm = 50\hspace{0.3cm} \Rightarrow \hspace{0.3cm} 10 \cdot {\rm lg}\hspace{0.1cm}\rho_{\rm V2} \hspace{0.15cm}\underline{= {16.99 \, \rm dB}}.$$
- Despite the same distortion power $10 \cdot {\rm lg}\hspace{0.1cm}\rho_{\rm V2}$ is less than $10 \cdot {\rm lg}\hspace{0.1cm}\rho_{\rm V1}$ by about $6 \ \rm dB$ .
- The signal $y_2(t)$ is thus significantly less favourable in terms of SNR than $y_1(t)$.
- It is considered that now the power of the output signal is only a quarter of the input power due to $\alpha = 0.5$ .
- If this attenuation at the output was to be compensated by amplifying it by $1/\alpha$, the distortion power would indeed increase by $\alpha^2$.
- The signal-to-distortion-power ratio $\rho_{\rm V2}$ would, however, remain the same because the "useful signal" would also be increased by the same value.

