Contents
- 1 Properties of non-linear modulation methods
- 2 FSK – Frequency Shift Keying
- 3 Coherent demodulation of FSK
- 4 Error probability of orthogonal FSK
- 5 Binary FSK with Continuous Phase Matching
- 6 MSK – Minimum Shift Keying
- 7 Realizing MSK as Offset–QPSK
- 8 General Description of Continuous Phase Modulation
- 9 GMSK – Gaussian Minimum Shift Keying
- 10 Exercises for the chapter
- 11 References
Properties of non-linear modulation methods
All modulation methods can be alternatively classified as:
- amplitude, phase and frequency modulation,
- analog and digital modulation methods,
- linear and non-linear modulation methods.
Considering this last distinction, the following definition applies:
$\text{Definitions:}$
- A linear modulation method is present if any linear combination of signals at modulator input leads to a corresponding linear combination at its output.
- Otherwise, it is a non-linear modulation.
At the beginning of the present book it was already pointed out that the main difference between an analog and a digital modulation method is that
- in the first one an analog source signal $q(t)$ is present, and
- in the second one a digital signal.
However, a closer look will reveal that there are a few more differences between these methods. This will be discussed in more detail below.
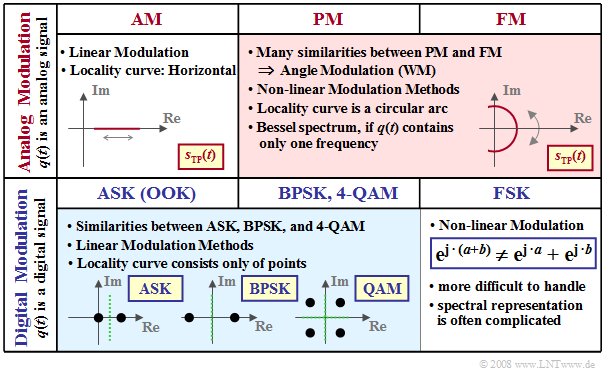
The following diagram shows some of the differences with respect to the classifications given above.
- Analog amplitude modulation $\rm (AM)$ is a linear method. The locus curve - that is, the equivalent low-pass signal $s_{\rm TP}(t)$ represented in the complex plane - is a straight line.
- Many similarities between analog phase modulation $\rm (PM)$ and analog frequency modulation $\rm (FM)$ ⇒ common description "angle modulation" (German: "Winkelmodulation") $\rm (WM)$.
- In that case, the locus curve is an arc of a circle. With a harmonic oscillation, there is a line spectrum $S(f)$ at multiples of the message frequency $f_{\rm N}$ around the carrier frequency $f_{\rm T}$.
- Digital amplitude modulation, referred to as either "Amplitude Shift Keying" $\rm (ASK)$ or as "On–Off–Keying" $\rm (OOK)$, is also linear. In the binary case, the locus curve consists of only two points.
- Since binary phase modulation $($"Binary Phase Shift Keying", $\rm BPSK)$ can be represented as $\rm ASK$ with bipolar amplitude coefficients, it is also linear. The shape of the BPSK power-spectral density is essentially determined by the magnitude square spectrum $|G_s(f)|^2$ of the basic transmission pulse.
- However, this also means: The BPSK spectrum is continuous in $f$, unlike the analog PM of a harmonic oscillation (only one frequency!). If one were to consider BPSK as analog PM with digital source signal $q(t)$, then an infinite number of Bessel line spectra would have to be convolved together to calculate the power-spectral density ${\it Φ}_s(f)$ when $Q(f)$ is represented as an infinite sum of individual frequencies.
- Since quadrature amplitude modulation with four signal space points $\rm (4–QAM)$ can also be described as the sum of two mutually orthogonal, quasi-independent BPSK systems, it too represents a linear modulation scheme. The same applies to the higher-level QAM methods such as $\rm 16–QAM$, $\rm 64–QAM$, ...
- Higher-level "Phase Shift Keying", such as $\rm 8–PSK$, is linear only in special cases, see [Klo01][1]. Digital frequency modulation $($"Frequency Shift Keying", $\rm FSK)$ is always non-linear. This method is described below, where we restrict our focus to the binary case $\rm (2-FSK)$ .
FSK – Frequency Shift Keying
$\text{Now we assume:}$
- the transmitted signal of the analog frequency modulation,
- $$s(t) = s_0 \cdot \cos\hspace{-0.05cm}\big [\psi(t)\big ] \hspace{0.5cm} {\rm with} \hspace{0.5cm} \psi(t) = 2\pi f_{\rm T} \hspace{0.05cm}t + K_{\rm FM} \cdot \int q(t)\hspace{0.1cm} {\rm d}t,$$
- the rectangular binary source signal with $a_ν ∈ \{+1, –1\}$ ⇒ bipolar signaling:
- $$q(t) = \sum_{\nu = - \infty}^{+\infty}a_{ \nu} \cdot g_s (t - \nu \cdot T) \hspace{0.5cm} {\rm with} \hspace{0.5cm} g_s(t) = \left\{ \begin{array}{l} A \\ 0 \\ \end{array} \right.\quad \begin{array}{*{5}c}{\rm{for} } \\{\rm{ } } \\ \end{array}\begin{array}{*{10}c} \hspace{0.05cm}0 < t < T\hspace{0.05cm}, \\ {\rm otherwise} \hspace{0.05cm}. \\ \end{array}$$
- Summarizing the amplitude $A$ and the modulator constant $K_{\rm FM}$ into the "frequency deviation" (see below for definition)
- $${\rm \Delta}f_{\rm A} = \frac{A \cdot K_{\rm FM}}{2 \pi},$$
- then the FSK transmitted signal in the $ν$–th time interval is:
- $$s(t) = s_0 \cdot \cos\hspace{-0.05cm}\big [2 \pi \cdot t \cdot (f_{\rm T}+a_{ \nu} \cdot {\rm \Delta}f_{\rm A} ) \big ]\hspace{0.05cm}.$$
- This can be calculated with the two possible signal frequencies
- $$f_{\rm +1} = f_{\rm T} +{\rm \Delta}f_{\rm A} \hspace{0.05cm}, \hspace{0.2cm}f_{\rm -1} = f_{\rm T} -{\rm \Delta}f_{\rm A}$$
- and written as:
- $$s(t) = \left\{ \begin{array}{l} s_0 \cdot \cos (2 \pi \cdot f_{\rm +1} \cdot t ) \\ s_0 \cdot \cos (2 \pi \cdot f_{\rm -1} \cdot t ) \\ \end{array} \right.\quad \begin{array}{*{5}c}{\rm{for}} \\{\rm{for}} \\ \end{array}\begin{array}{*{10}c} \hspace{0.05cm}a_{ \nu} = +1 \hspace{0.05cm}, \\ \hspace{0.05cm}a_{ \nu} = -1\hspace{0.05cm}. \\ \end{array}$$
- Thus, at any given time, only one of the two frequencies $f_{+1}$ and $f_{–1}$ arises. The carrier frequency $f_{\rm T}$ itself does not occur in the signal.
$\text{Definition:}$ The frequency deviation $Δf_{\rm A}$
- is defined in the same way as for analog frequency modulation, namely
- as the maximum deviation of the instantaneous frequency $f_{\rm A}(t)$ from the carrier frequency $f_{\rm T}$:
- $$ {\rm \Delta}f_{\rm A} =f_{\rm +1} - f_{\rm T}\hspace{0.05cm}, \hspace{0.2cm}f_{\rm -1} = f_{\rm T} -f_{\rm -1}.$$
Sometimes, the total frequency deviation $ 2 \cdot {\rm \Delta}f_{\rm A} =f_{\rm +1} - f_{\rm -1}$ is used in the literature.
Another important descriptive quantity in this context is the "modulation index", which was also already defined for analog frequency modulation as $η = Δf_{\rm A}/f_{\rm N}.$ For FSK, a slightly different definition is required, which is taken into account here with a different variable symbol: $η ⇒ h$.
$\text{Definitions:}$
- For digital frequency modulation $\rm (FSK)$, the modulation index $h$ denotes the ratio of the total frequency deviation and the symbol rate $1/T$:
- $$h = \frac{2 \cdot {\rm \Delta}f_{\rm A} }{1/T} = 2 \cdot {\rm \Delta}f_{\rm A}\cdot T \hspace{0.05cm}.$$
- Sometimes $h$ is also referred to as phase deviation in the literature.
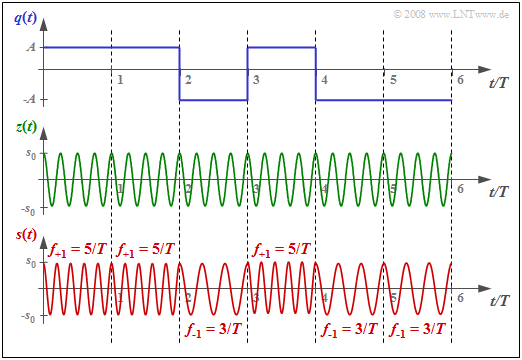
$\text{Example 1:}$ The graph below shows the FSK transmitted signal $s(t)$ for
- the binary source signal $q(t)$ sketched above with amplitude values $\pm A =\pm 1 \ \rm V$, and
- the carrier signal $z(t)$ drawn below with four oscillations per symbol duration $(f_{\rm T} · T = 4)$.
This results in the following characteristic values for the FSK system:
- The underlying frequency deviation is $Δf_{\rm A} = 1/T$.
- The modulation index is $h = 2$.
- The two possible frequencies are $f_{\rm +1} = 5/T \hspace{0.05cm},\hspace{0.2cm}f_{\rm -1} = 3/T \hspace{0.05cm}.$
Thus, for an FSK transmission system with bit rate $1 \ {\rm Mbit/s} \ \ (T = 1 \ \rm µ s)$, the following FM constant would have to be used:
- $$K_{\rm FM} = \frac{2 \pi \cdot {\rm \Delta}f_{\rm A} }{A } = \frac{2 \pi }{A \cdot T } \approx 6.28 \cdot 10^{6}\,\,{\rm V^{-1}s^{-1} }\hspace{0.05cm}.$$
Coherent demodulation of FSK
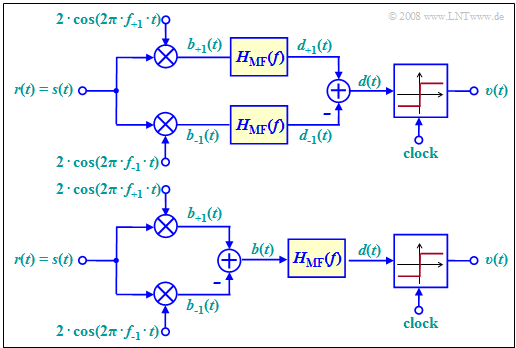
The diagram shows the best possible demodulator for binary FSK that operates coherently.
- It thus requires knowledge of the phase of the FSK signal.
- This is accounted for in the block diagram by assuming that the received signal $r(t)$ is equal to the transmitted signal $s(t)$.
This demodulator operates according to following principle (see upper arrangement):
- We are dealing with a maximum–likelihood receiver $\rm (ML)$ with Matched-Filter realization. This filter with frequency response $H_{\rm MF}(f)$ can also be realized as an integrator with rectangular basic transmission pulse $g_s(t)$.
- Both signals $b_{+1}(t)$ and $b_{–1}(t)$ before their corresponding matched–filters are obtained by phase-appropriate multiplication with the oscillations of the frequencies $f_{+1}$ and $f_{–1}$, respectively.
- The maximum-likelihood receiver is known to decide on the branch (for the symbol) with the larger "metric", taking into account the following matched filter.
- This means: $a_ν = +1$ was probably sent if the following condition is satisfied:
- $$d_{\rm +1}(\nu \cdot T) > d_{\rm -1}(\nu \cdot T) $$
- $$\Rightarrow \hspace{0.3cm} d(\nu \cdot T) = d_{\rm +1}(\nu \cdot T) - d_{\rm -1}(\nu \cdot T) > 0\hspace{0.05cm}.$$
The upper block diagram has been drawn according to this description for better understanding.
- Of course, matched filtering could instead also be moved to the right of the discrimination, as shown in the lower model.
- Then only one filter has to be implemented.
- In Exercise 4.13 , this FSK demodulator is discussed in detail.
- On the exercise page you can also see the corresponding signal waveforms.
Error probability of orthogonal FSK
$\text{Definition:}$ One speaks of orthogonal FSK,
- if the modulation index $h$ is an integer multiple of $0.5$, and thus
- the frequency deviation $Δf_{\rm A}$ is an integer multiple of $0.25/T$.
For the coherent demodulator, the correlation coefficient between $d_{+1}(T_{\rm D})$ and $d_{–1}(T_{\rm D})$ is zero at all detection times. Thus, the magnitude $|d(T_{\rm D})|$ – the distance of the detection samples from the threshold – is constant. No intersymbol interference occurs.
If one assumes
- orthogonal FSK,
- an AWGN channel $($captured by the quotient $E_{\rm B}/N_0)$, and
- the coherent demodulation described here,
then the bit error probability is given by:
- $$p_{\rm B} = {\rm Q}\left ( \sqrt{{E_{\rm B}}/{N_0 }} \hspace{0.1cm}\right ) = {1}/{2}\cdot {\rm erfc}\left ( \sqrt{{E_{\rm B}}/(2 N_0 }) \hspace{0.1cm}\right ).$$
This corresponds to a degradation of $3 \ \rm dB$ compared to BSPK because
- although the coherent FSK demodulator gives the same result with respect to the useful signal,
- and the noise powers in the two branches are also exactly the same as with BPSK,
- due to the subtraction, the total noise power is doubled.
However, while non-coherent demodulation is not possible under any circumstances in binary phase modulation (BPSK), there is also a "non-coherent FSK demodulator", but with a somewhat increased probability of error:
- $$p_{\rm B} = {1}/{2} \cdot {\rm e}^{- E_{\rm B}/{(2N_0) }}\hspace{0.05cm}.$$
The derivation of this equation is given in the chapter "Carrier Frequency Systems with Non-Coherent Demodulation" of the book "Digital Signal Transmission".
Binary FSK with Continuous Phase Matching
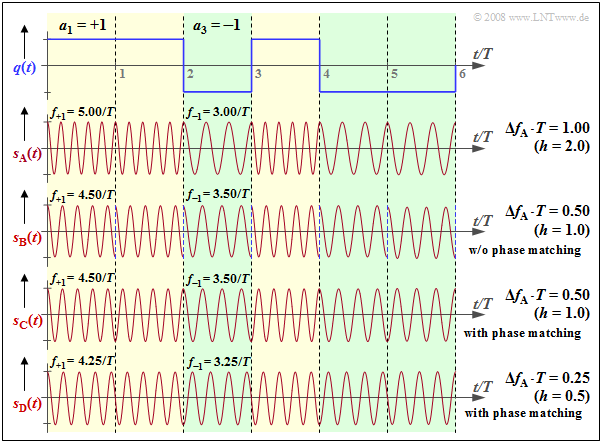
We continue to consider the orthogonal FSK. The graph shows the source signal $q(t)$ at the top and, drawn below, the FSK signal $s_{\rm A}(t)$ with frequency deviation $Δf_{\rm A} = 1/T$ ⇒ modulation index $h = 2 · Δf_{\rm A} · T = 2$. The following should be noted about the other signal waveforms:
- The signal $s_{\rm B}(t)$ uses instantaneous frequencies $f_{+1} = 4.5/T$, $f_{–1} = 3.5/T$ ⇒ $Δf_{\rm A} ·T = 0.5$ ⇒ $h = 1$. This FSK is also orthogonal because of $h = 1$ $($multiple of $0.5)$. However, with smaller $h$, the bandwidth efficiency is better ⇒ the spectrum $S_{\rm B}(f)$ is narrower than $S_{\rm A}(f)$.
- However, in the signal $s_{\rm B}(t)$, one can see a phase jump by $π$ at each symbol boundary, which again results in a broadening of the spectrum. Such phase jumps can be avoided by phase matching. This is then referred to as Continuous Phase Modulation $\rm (CPM)$.
- Also, for the CPM signal $s_{\rm C}(t)$, $f_{+1} = 4.5/T, f_{–1} = 3.5/T$ and $h = 1$ hold. In the range $0$ ... $T$, the coefficient $a_1 = +1$ is represented by $\cos (2π·f_{+1}·t)$, and in the range $T$ ... $2T$, on the other hand, the also positive coefficient $a_2 = +1$ is represented by $\ –\cos (2π·f_{+1}·t)$ ⇒ shifted by $π$.
- The modulation index $h = 0.5$ of signal $s_{\rm D}(t)$ is the smallest value that allows orthogonal FSK ⇒ Minimum Shift Keying $\rm (MSK)$. In MSK, four different initial phases are possible at each symbol boundary, depending on the previous symbols.
⇒ The (German language) SWF applet "Frequency Shift Keying & Continuous Phase Modulation" illustrate the facts presented here.
MSK – Minimum Shift Keying
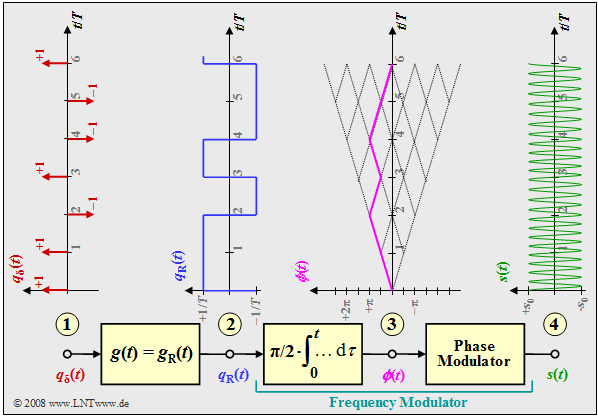
The graphic shows the block diagram for generating an MSK modulation and typical signal properties at various points of the MSK transmitter. One can recognize
- the digital source signal at point (1), a sequence of Dirac impulses spaced by $T$, weighted by the coefficients $a_ν ∈ \{–1, +1\}$:
- $$q_\delta(t) = \sum_{\nu = - \infty}^{+\infty}a_{ \nu} \cdot \delta (t - \nu \cdot T)\hspace{0.05cm};$$
- the rectangular signal $q_{\rm R}(t)$ at point (2) after convolution with the rectangular pulse $g(t)$ of duration $T$ and height $1/T$:
- $$q_{\rm R}(t) = \sum_{\nu = - \infty}^{+\infty}a_{ \nu} \cdot g (t - \nu \cdot T)\hspace{0.05cm},$$
- the frequency modulator (integrator and following phase modulator). For the signal at point (3):
- $$\phi(t) = {\pi}/{2}\cdot \int_{0}^{t} q_{\rm R}(\tau)\hspace{0.1cm} {\rm d}\tau \hspace{0.05cm}.$$
- The phase values at multiples of the symbol duration $T$ are multiples of $π/2$, when taking into account the modulation index $h = 0.5$ for the MSK method. The phase response is linear.
- From this, the MSK signal at point (4) of the diagram is given by:
- $$s(t) = s_0 \cdot \cos (2 \pi f_{\rm T} \hspace{0.05cm}t + \phi(t)) $$
- $$\Rightarrow \hspace{0.3cm} s(t) = s_0 \cdot \cos (2 \pi \cdot t \cdot (f_{\rm T}+a_{ \nu} \cdot {\rm \Delta}f_{\rm A} )) \hspace{0.05cm}.$$
Realizing MSK as Offset–QPSK
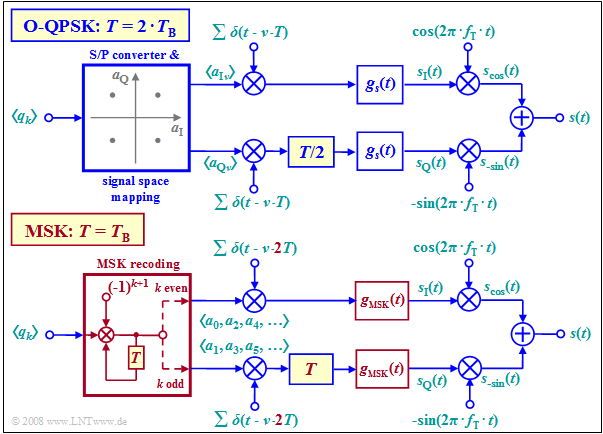
"Minimum Shift Keying" $\rm (MSK)$ can also be realized by modified implementation of "Offset–QPSK".
Compared with the conventional offset QPSK implementation (upper graph), the following modifications must be taken into account, which are highlighted in red in the lower graph:
- The MSK symbol duration $T$ is equal to the bit duration $T_{\rm B}$ of the binary input signal, while in original Offset-QPSK, $T = 2 \cdot T_{\rm B}$.
- Instead of serial-to-parallel conversion and signal space allocation, the source symbols must now be recoded:
- $$a_k = (–1)^{k+1} · a_{k–1} · q_k.$$
- All amplitude coefficients $a_k$ with an even index $(a_0,\ a_2$, ...$)$ are applied to the Dirac comb in the upper branch, while $a_1,\ a_3$, ... are transmitted in the lower branch.
- The spacing of the individual Dirac pulses of the "Dirac comb" is now $2T$ instead of $T$ and the offset in the quadrature branch is no longer $T/2$, but $T$. In both cases, the offset is equal to $T_{\rm B}$.
- While in conventional Offset-QPSK implementation any basic transmission pulse $g_s(t)$ is possible, e.g. a rectangular or a root-Nyquist pulse, there is only one suitable basic pulse for MSK implementation. This spans two symbol durations:
- $$g_{\rm MSK}(t) = \left\{ \begin{array}{l} s_0 \cdot \cos \big ({\pi/2 \cdot t}/T \big ) \\ 0 \\ \end{array} \right.\quad \begin{array}{*{5}c} {\rm{for}} \\ \\ \end{array}\begin{array}{*{10}c} -T \le t \le +T \hspace{0.05cm}, \\ {\rm otherwise}\hspace{0.05cm}. \\ \end{array}$$
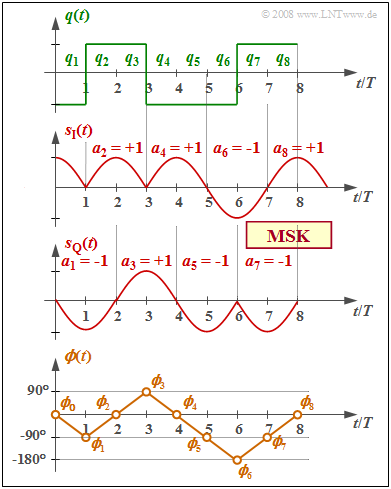
$\text{Example 2:}$ The graph shows
- the binary bipolar source signal $q(t)$ at the top,
- in the middle, the equivalent low-pass signals $s_{\rm I}(t)$ and $s_{\rm Q}(t)$ in the $\rm I$ and $\rm Q$ branches, resp.,
- below, the phase response $ϕ(t)$ of the total MSK transmitted signal $s(t)$.
The recoding $a_k = (–1)^{k+1} · a_{k–1} · q_k$ is already taken into account, as well as the MSK basic pulse:
- $$g_{\rm MSK}(t) = \left\{ \begin{array} {l} s_0 \cdot \cos ({\pi \cdot t}/{2 \cdot T}) \\ 0 \\ \end{array} \right.\quad \begin{array}{*{5}c}{\rm{for} } \\ \\ \end{array}\begin{array}{*{10}c} -T \le t \le +T \hspace{0.05cm}, \\ {\rm otherwise}\hspace{0.05cm}. \\ \end{array}$$
From the comparison of the top and the bottom diagrams, one can see:
- The MSK phase response $ϕ(t)$ is step-wise linear and increases or decreases by $90^\circ \ (π/2)$ within each symbol duration, depending on whether $q_k = +1$ or $q_k = -1$ currently holds.
- The associated transmitted signal $s(t)$ contains the two frequencies $f_{\rm T} ± 1/(4T)$ in sections. It has basically the same shape as the signal $s_{\rm D}(t)$ in the section Binary FSK with CPM.
⇒ You can represent this MSK realization form with the SWF applet "Quaternary Phase Shift Keying and Offset-QPSK" using the following settings: "Offset–QPSK" – "MSK allocation" – "cosine pulse".
General Description of Continuous Phase Modulation
We will further assume that the source is characterized by the amplitude coefficients $a_ν$.
- These can be binary as well as $M$–levelled.
- However, they should always be considered bipolar, e.g. $a_ν\in \{+1, -1\}$.
The phase function $ϕ(t)$ in "Continuous Phase Modulation" $\rm (CPM)$ can be generally represented in the following form $(h$ denotes the modulation index$)$:
- $$\phi(t) = {\pi}\cdot h \cdot\int_{-\infty}^{t} \sum_{\nu = - \infty}^{+\infty}a_{ \nu} \cdot g (\tau - \nu \cdot T)\hspace{0.1cm} {\rm d}\tau \hspace{0.05cm}.$$
- In this representation, $g(t)$ denotes the "frequency pulse", which must satisfy the following condition:
- $$\int_{-\infty}^{+\infty} g (t)\hspace{0.1cm} {\rm d}t = 1 \hspace{0.05cm}.$$
- But the following relationship also holds with the "phase pulse" $g_ϕ(t)$:
- $$\phi(t) = {\pi}\cdot h \cdot \sum_{\nu = - \infty}^{+\infty}a_{ \nu} \cdot g_\phi (t - \nu \cdot T),\hspace{0.2cm}{\rm where}\hspace{0.2cm}g_\phi(t) = \int_{-\infty}^{t} g (\tau )\hspace{0.1cm} {\rm d}\tau\hspace{0.05cm}.$$
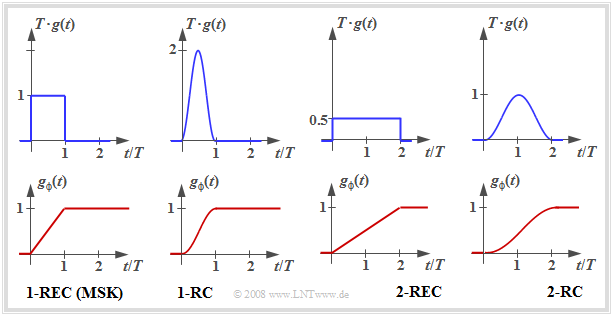
Many CPM variants can be realized by appropriately choosing the pulses $g(t)$ and $g_ϕ(t)$ . Some of them are shown on the right.
- the individual graphs show the CPM frequency pulse $g(t)$ above and the CPM phase pulse $g_ϕ(t)$ below.
- The two graphs on the left describe "$\rm MSK$".
- The "$\rm 1–REC$" designation indicates that $g(t)$ spans a single symbol duration $(T)$ and is rectangular in shape.
The other CPM variants were designed with the goal of further reducing the already small bandwidth of the MSK signal:
- For "$\rm 1–RC$", a narrower power-spectral density results just because of the "softer" raised-cosine pulse $g(t)$ compared to the rectangular pulse.
- "$\rm 2–RC$" and "$\rm 2–REC$" are partial–response pulses, each over $2T$. This softens the phase response. However, it also makes demodulation more difficult, since selective pseudo-steps are introduced into the data signal.
The spectral calculation of CPM procedures is complicated in general. Only the special case "MSK" leads to equations which are easy to handle, as shown in Exercise 4.14.
$\text{Conclusion:}$ The Continuous Phase Modulation $\rm (CPM)$ it is not a phase modulation, but is a non-linear digital frequency modulation $\rm (FSK)$, with the goal
- of guaranteeing a constant magnitude envelope $($dips in the envelope lead to problems even with small non-linearities$)$, and
- to enable a continuous phase progression $($phase jumps broaden the spectrum$)$.
For detailed information we refer to the technical literature, for example in the recommended text book [Kam04][2].
GMSK – Gaussian Minimum Shift Keying
One advantage of Minimum Shift Keying is the low bandwidth requirement, because: Bandwidth is always expensive.
- A slight modification to Gaussian Minimum Shift Keying $\rm (GMSK)$ further narrows the spectrum.
- This type of modulation is used, for example, in the GSM mobile communications standard.
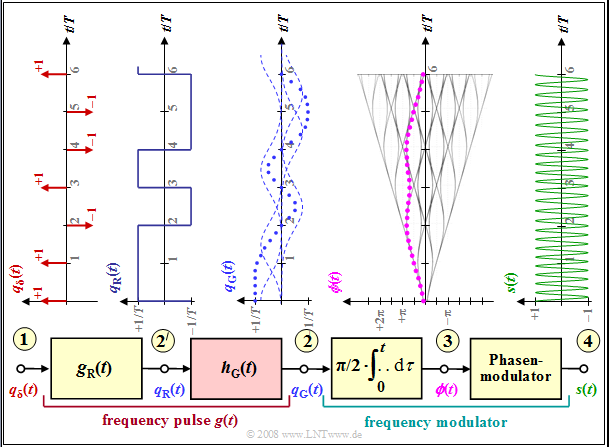
From the graph one can see:
- the frequency pulse $g(t)= g_{\rm G}(t)$ is now no longer rectangular like $g_{\rm R}(t)$, but has flatter edges.
- This results in a smoother phase response at point (3) than in MSK, where $ϕ(t)$ rises / falls linearly within each symbol.
- One achieves the smoother GMSK phase transitions by using a Gaussian low-pass. With the system-theoretic cutoff frequency $f_{\rm G}$, its frequency response and impulse response are as follows:
- $$H_{\rm G}(f) = {\rm e}^{-\pi\cdot (\frac{f}{2 \cdot f_{\rm G}})^2} \hspace{0.2cm}\bullet\!\!-\!\!\!-\!\!\!-\!\!\circ\, \hspace{0.2cm} h_{\rm G}(t) = 2 f_{\rm G} \cdot {\rm e}^{-\pi\cdot (2 \cdot f_{\rm G}\cdot t)^2}\hspace{0.05cm}.$$
- The resulting frequency pulse $g(t)$ at point (2) is obtained by convolution of $g_{\rm R}(t)$ and $h_{\rm G}(t)$.
- The GMSK transmitted signal $s(t)$ at point (4) has no longer a constant frequency $($section by section, per symbol duration$)$ as it does in MSK, even though this is difficult to see with the naked eye from the above graph.
$\text{Example 3:}$ In the GSM method, the cutoff frequency is specified as $f_\text{3dB} = 0.3/T$, where the following relationship exists
- between the "system-theoretic cutoff frequency" $f_\text{G}$
- and the "3dB cutoff frequency" $f_\text{3dB}$:
- $$H_{\rm G}(f= f_{\rm 3 \hspace{0.03cm}dB}) = {\rm e}^{-\pi\cdot ({f_{\rm 3 \hspace{0.03cm}{dB} } }/{2 f_{\rm G} })^2} = {1}/{\sqrt{2} }\hspace{0.3cm} \Rightarrow\hspace{0.3cm} f_{\rm 3 dB} = f_{\rm G} \cdot \sqrt { {4}/{\pi}\cdot {\rm ln }\sqrt{2} }\approx {2}/{3}\cdot f_{\rm G} \hspace{0.05cm}.$$
From $f_{\rm 3dB} = 0.3/T$ ⇒ $f_{\rm G} ≈ 0.45/T$.
Exercises for the chapter
Exercise 4.13: FSK Demodulation
Exercise 4.14: Phase Progression of the MSK
Exercise 4.14Z: Offset QPSK vs. MSK
Exercise 4.15: MSK Compared with BPSK and QPSK
Exercise 4.15Z: MSK Basic Pulse and MSK Spectrum
Exercise 4.16: Comparison between Binary PSK and Binary FSK
References
