Exercise 2.5Z: Nyquist Equalization
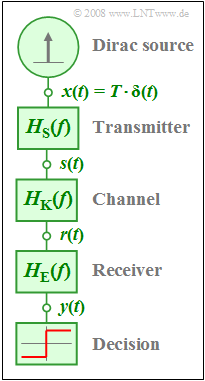
A digital baseband transmission system is modelled by the depicted block diagram.
- The transmitter, channel and receiver components are described in the frequency domain by $H_{\rm S}(f)$, $H_{\rm K}(f)$ and $H_{\rm E}(f)$ .
- The overall frequency response $H(f) = H_{\rm S}(f) \cdot H_{\rm K}(f) \cdot H_{\rm E}(f)$ has a $\cos^2$–shaped curve:
- $$H(f) = \left\{ \begin{array}{c} \cos^2\left({\pi}/{2} \cdot f \cdot T \right) \\ 0 \\ \end{array} \right.\quad \quad \begin{array}{*{10}c} {\rm{f\ddot{u}r}} \\ {\rm{f\ddot{u}r}} \\ \end{array}\begin{array}{*{20}c} {\left| \hspace{0.005cm} f\hspace{0.05cm} \right| < 1/T,} \\ {\left|\hspace{0.005cm} f \hspace{0.05cm} \right| \ge 1/T.} \\ \end{array}$$
- The signal $y(t)$ before the decision circuit thus exhibits equidistant zero crossings at intervals of $T$ .
- It is assumed here that the source transmits a Dirac-delta $x(t)$ with weight $T$ (see graph).
It is pointed out that this is a so-called "Nyquist system".
As will be discussed in detail in the book Digital Signal Transmission, these Nyquist systems represent an important class of digital transmission systems since the sequentially transmitted symbols do not influence each other in such systems.
However, these far-reaching aspects are not needed for the solution of this task.
Here, it is only assumed that
- the transmission pulse $s(t)$ be rectangular with pulse duration $T$:
- $$H_{\rm S}(f) = {\rm si}(\pi f T)= {\rm sinc}(f T)\hspace{1.0cm} \Rightarrow \hspace{0.5cm} {\rm si}(x) = \sin(x)/x,\hspace{0.5cm}{\rm sinc}(x) = \sin(\pi x)/(\pi x),$$
- the channel is assumed to be ideal up to and including subtask (2) while for the last subtask (3) the following shall hold:
- $$H_{\rm K}(f) = H_{\rm G}(f) = {\rm e}^{-\pi(f \cdot T)^2} .$$
For both channels, the receiver and the equalizer frequency response $H_{\rm E}(f)$ are searched-for so that the overall frequency response has the desired Nyquist shape.
Please note:
- The task belongs to the chapter Linear Distortions.
- The following trigonometric relation is assumed to be known:
- $$\frac{\cos^2(\alpha /2)}{\sin(\alpha )} = {1}/{2} \cdot {\rm cot}(\alpha /2) .$$
Questions
Solution
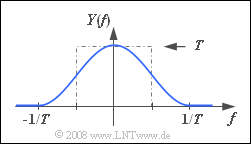
(1) Using the constant spectrum $X(f) = T$ the following is obtained for the spectral function of the output signal $y(t)$:
- $$Y(f)= T \cdot {H(f)}.$$
- The signal value at $t = 0$ is equal to the area under $Y(f)$.
- As can be seen from the adjacent sketch, this is equal to $1$.
- From this it follows that:
- $$y(t = 0)\; \underline{= 1}.$$
(2) From the condition $H_{\rm S}(f) \cdot H_{\rm E}(f) = H(f)$ it follows in the considered range:
- $$H_{\rm E}(f)= \frac{H(f)}{H_{\rm S}(f)} = \frac{\cos^2(\pi f T/2)}{\sin(\pi f T)/(\pi f T)}.$$
- Due to $\cos(0) = 1$ and ${\rm si}(0) = 1$, $H_{\rm E}(f = 0)\;\underline{=1}$ also holds.
- Considering the given trigonometric transformation it further holds:
- $$H_{\rm E}(f) = {\pi f T}/{2} \cdot {\rm cot}\left( {\pi f T}/{2}\right),$$
- $$H_{\rm E}(f \cdot T = 0.25) = {\pi }/{8} \cdot {\rm cot}\left( 22.5^{\circ}\right) = {\pi }/{8} \cdot 2.414 = \hspace{0.15cm}\underline{0.948},$$
- $$H_{\rm E}(f \cdot T = 0.50) = {\pi }/{4} \cdot {\rm cot}\left( 45^{\circ}\right) = {\pi }/{4} \cdot 1 \hspace{0.15cm}\underline{= 0.785},$$
- $$ H_{\rm E}(f \cdot T = 0.75) = {3 \pi }/{8} \cdot {\rm cot}\left( 67.5^{\circ}\right) = {3 \pi }/{8} \cdot 0.414 \hspace{0.15cm}\underline{= 0.488},$$
- $$ H_{\rm E}(f \cdot T = 1.00)= { \pi }/{2} \cdot {\rm cot}\left( 90^{\circ}\right) ={ \pi }/{2} \cdot 0 \hspace{0.15cm}\underline{ = 0}.$$
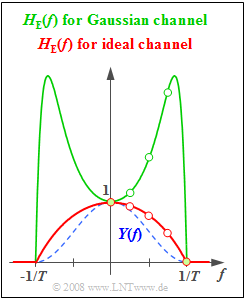
The red curve in the graph summarises the results of this subtask.
(3) Considering the Gaussian channel the following holds:
- $$H_{\rm E}(f)= \frac{H(f)}{H_{\rm S}(f) \cdot H_{\rm K}(f)} = H_{\rm E}^{(2)}(f)\cdot {\rm e}^{\pi (f\hspace{0.05cm}\cdot \hspace{0.05cm} T)^2}.$$
Here, $H_{\rm E}^{(2)}(f)$ denotes the equalizer frequency response computed in the subtask (2) assuming an ideal channel.
The following numerical results are obtained:
- $$H_{\rm E}(f\cdot T = 0) = 1 \cdot {\rm e}^{0} \hspace{0.15cm}\underline{= 1},$$
- $$H_{\rm E}(f \cdot T = 0.25) = 0.948 \cdot 1.217 \hspace{0.15cm}\underline{= 1.154},$$
- $$H_{\rm E}(f \cdot T = 0.50) = 0.785 \cdot 2.193 \hspace{0.15cm}\underline{= 1.722},$$
- $$H_{\rm E}(f \cdot T = 0.75) = 0.488 \cdot 5.854 \hspace{0.15cm}\underline{= 2.857},$$
- $$H_{\rm E}(f \cdot T = 1.00) = 0 \cdot 23.141 \hspace{0.15cm}\underline{= 0}.$$
The green curve in the graph above summarises the results of this subtask.


