Exercise 3.5Z: Application of the Residue Theorem
Let the spectral function $Y_{\rm L}(p)$ be given in pole–zero notation characterized by
- $Z$ zeros $p_{{\rm o}i}$,
- $N$ poles $p_{{\rm x}i}$, and
- the constant $K$.
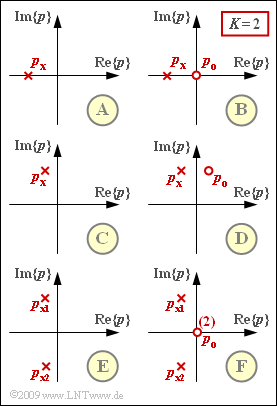
In the following, the configurations shown in the diagram are considered. Let always $K= 2$ hold.
In the case that the number $Z$ of zeros is less than the number $N$ of poles, the corresponding time signal $y(t)$ can be determined directly by applying the residue theorem .
In this case:
- $$y(t) = \sum_{i=1}^{I} \left \{ Y_{\rm L}(p)\cdot (p - p_{{\rm x}i})\cdot {\rm e}^{\hspace{0.05cm}p \hspace{0.05cm}t} \bigg |_{p \hspace{0.05cm}= \hspace{0.05cm}p_{{\rm x}i}} \right \} \hspace{0.05cm}.$$
$I$ indicates the number of distinguishable poles; $I = N$ holds for all given constellations.
Please note:
- The exercise belongs to the chapter Inverse Laplace Transform.
- If the time signal $y(t)$ is complex, then $Y_{\rm L}(p)$ cannot be realized as a circuit. However, the application of the residue theorem is still possible.
- The complex frequency $p$, the zeros $p_{{\rm o}i}$ as well as the poles $p_{{\rm x}i}$ each describe normalized quantities without units in this exercise.
- Thus, time $t$ is dimensionless, too.
Questions
Solution
- The prerequisite for the application of the residue theorem is that there are fewer zeros than poles, that is, $Z < N$ must hold.
- This condition is not met for the configurations $\rm B$, $\rm D$ and $\rm F$.
- First, a partial fraction decomposition must be made here, for example for configuration $\rm B$ with $p_x = -1$:
- $$Y_{\rm L}(p)= \frac {p} {p +1}= 1-\frac {1} {p +1} \hspace{0.05cm} .$$
(2) Considering $Y_{\rm L}(p) = 2/(p+1)$ it follows from the residue theorem with $I=1$:
- $$y(t) = 2 \cdot {\rm e}^{\hspace{0.05cm}p \hspace{0.05cm}t} \bigg |_{p \hspace{0.05cm}= \hspace{0.05cm}-1}= 2 \cdot {\rm e}^{- \hspace{0.05cm}t}\hspace{0.3cm}\Rightarrow \hspace{0.3cm}y(t=1) =\frac{2}{\rm e} \hspace{0.15cm}\underline{ \approx 0.736 \hspace{0.15cm}{\rm (purely\hspace{0.15cm}real)}} \hspace{0.05cm} .$$
(3) Using the same procedure as in subtask (2) the following is obtained:
- $$y(t) = 2 \cdot {\rm e}^{\hspace{0.05cm}-(0.2 \hspace{0.05cm}+ \hspace{0.05cm}{\rm j} \hspace{0.05cm}\cdot \hspace{0.05cm}1.5 \pi) \hspace{0.05cm} \cdot \hspace{0.05cm}t} = 2 \cdot {\rm e}^{\hspace{0.05cm}-0.2 \hspace{0.08cm}\cdot \hspace{0.05cm}t}\cdot {\rm e}^{\hspace{0.05cm}-{\rm j} \hspace{0.08cm}\cdot \hspace{0.05cm}1.5 \pi\hspace{0.05cm}\cdot \hspace{0.05cm}t} \hspace{0.05cm} .$$
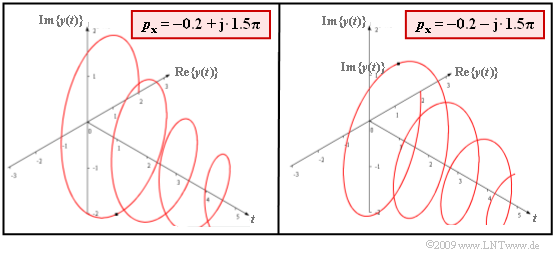
- Due to the second term, it is a complex signal whose phase rotates in the mathematically positive direction (counterclockwise) .
- For time $t=1$, the following holds:
- $$y(t = 1) = 2 \cdot {\rm e}^{\hspace{0.05cm}-0.2} \cdot \big [ \cos(1.5 \pi) + {\rm j} \cdot \sin(1.5 \pi) \big ]= - {\rm j} \cdot 1.638$$
- $$\Rightarrow \hspace{0.3cm}{\rm Re}\{y(t = 1)\} \hspace{0.15cm}\underline{ = 0},\hspace{0.2cm} {\rm Im}\{y(t = 1)\} \hspace{0.15cm}\underline{=- 1.638} \hspace{0.05cm} .$$
- The left graph shows the signal for a pole at $p_x = -2 + {\rm j} \cdot 1.5 \pi$.
- The right graph shows the conjugate complex signal to it can be seen for $p_x = -2 - {\rm j} \cdot 1.5 \pi$.
(4) Now $I=2$ holds. The residuals of $p_{x1}$ and $p_{x2}$ yield:
- $$y_1(t) = \frac {K \cdot (p-p_{{\rm x}1})} { (p-p_{{\rm x}1})(p-p_{{\rm x}2})} \cdot {\rm e}^{\hspace{0.05cm}p\hspace{0.05cm}\cdot \hspace{0.05cm}t} \bigg |_{p \hspace{0.05cm}= \hspace{0.05cm}p_{{\rm x}1}}= \frac {K } { p_{{\rm x}1}-p_{{\rm x}2}} \cdot {\rm e}^{\hspace{0.05cm}p_{{\rm x}1}\hspace{0.05cm}\cdot \hspace{0.05cm}t} \hspace{0.05cm} ,$$
- $$ y_2(t) = \frac {K } { p_{{\rm x}2}-p_{{\rm x}1}} \cdot {\rm e}^{\hspace{0.05cm}p_{{\rm x}2}\hspace{0.05cm}\cdot \hspace{0.05cm}t}= -\frac {K } { p_{{\rm x}1}-p_{{\rm x}2}} \cdot {\rm e}^{-p_{{\rm x}1}\hspace{0.05cm}\cdot \hspace{0.05cm}t}$$
- $$y(t)= y_1(t)+y_2(t) = \frac {2 \cdot {\rm e}^{\hspace{0.05cm}-0.2 \hspace{0.08cm}\cdot \hspace{0.05cm}t}}{{\rm j} \cdot 3 \pi} \cdot \big [ \cos(.) + {\rm j} \cdot \sin(.) - \cos(.) + {\rm j} \cdot \sin(.)\big ]$$
- $$\Rightarrow \hspace{0.3cm}y(t)= \frac {4 }{ 3 \pi} \cdot {\rm e}^{\hspace{0.05cm}-0.2 \hspace{0.08cm}\cdot \hspace{0.05cm}t}\cdot \sin(1.5\pi \cdot t)$$
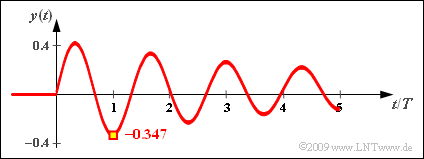
- $$\Rightarrow \hspace{0.3cm}y(t=1)= -\frac {4 }{ 3 \pi} \cdot {\rm e}^{\hspace{0.05cm}-0.2 \hspace{0.08cm}\cdot \hspace{0.05cm}t} \hspace{0.15cm}\underline{= -0.347} \hspace{0.05cm} .$$
The graph shows the (purely real) signal curve $y(t)$ for this configuration.


