Exercise 4.13: FSK Demodulation
The block diagram of the coherent FSK demodulator has already been given in the theory section, but in this exercise we will assume the lower system variant. Noise components are not considered here.
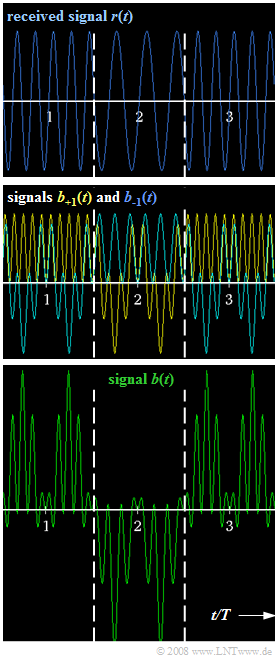
The figure on the right shows the signal waveforms at different points of the block diagram, where three symbols are drawn in each case, separated by dashed lines:
- At the top, the received signal $r(t)$ is shown, which is identical to the FSK transmitted signal. The higher frequency $f_{+1}$ belongs to the amplitude coefficient $a_ν = +1$, while $a_ν = -1$ is represented with frequency $f_{–1}$ . With respect to the symbol centers $T$, $2T$, $3T$, ..., a sinusoidal curve is present in each case. The constant magnitude of the envelope is $s_0$.
- The middle plot shows the signals after multiplication by the respective sinusoidal signals:
- $$b_{\rm +1}(t) = r(t) \cdot 2 \cdot \sin (2 \pi \cdot f_{\rm +1} \cdot t )\hspace{0.05cm},$$
- $$ b_{\rm -1}(t) = r(t) \cdot 2 \cdot \sin (2 \pi \cdot f_{\rm -1} \cdot t ) \hspace{0.05cm}.$$
- The signal $b_{+1}(t)$ in the upper demodulator branch is shown in yellow and the signal $b_{–1}(t)$ in the lower branch is shown in blue. According to the coloring scheme, the green curve applies to both curves. Relative to $r(t)$ , the signals are lower than shown.
- The lower signal plot shows the difference signal $b(t) = b_{+1}(t) - b_{–1}(t)$. The following matched filter can also be implemented as an integrator. Thus, the (normalized) decision boundary for the $ν$–th symbol is given as follows:
- $$E_{\nu}= \frac{1}{s_0} \cdot d (\nu \cdot T + T/2) = \frac{1}{s_0 \cdot T} \cdot \int_{(\nu - 1/2) T }^{(\nu + 1/2) T }\hspace{-0.3cm} b (t )\hspace{0.1cm} {\rm d}t \hspace{0.05cm}.$$
Hints:
- This exercise belongs to the chapter Nonlinear Digital Modulation.
- Particular reference is made to the page Coherent demodulation of FSK.
- A technical hint: By enlarging the image, one can recognize the signal curves a little better.
Please accept an apology on behalf of the author: blue on a black background is not great.
The following trigonometric relation is given:
- $$2 \cdot \sin(\alpha) \cdot \sin(\beta)= \cos(\alpha - \beta)- \cos(\alpha + \beta) \hspace{0.05cm}.$$
Questions
Solution
- $$a_1 \hspace{0.15cm}\underline {= +1},\hspace{0.2cm}a_2 \hspace{0.15cm}\underline {= -1},\hspace{0.2cm}a_3\hspace{0.15cm}\underline { = +1} \hspace{0.05cm}.$$
(2) From the graph, we can see five oscillations in the first and last time intervals and three in the second interval:
- $$f_{\rm +1} \hspace{0.15cm}\underline {= 5 \cdot 1/T},\hspace{0.2cm}f_{\rm -1}\hspace{0.15cm}\underline { = 3 \cdot 1/T} \hspace{0.05cm}.$$
- Thus, the carrier frequency is $f_{\rm T} = 4/T$ and the frequency deviation is $Δf_{\rm A} = 1/T$.
(3) In this range, where the first term represents the received signal $r(t)$ and the second term represents the oscillation added in the modulator:
- $$b_{\rm +1}(t) = s_0 \cdot \sin (2 \pi \cdot 5/T \cdot t )\cdot 2 \cdot \sin (2 \pi \cdot 5/T \cdot t )= s_0 \cdot \big [ 1 - \cos (2 \pi \cdot 10/T \cdot t )\big ] \hspace{0.05cm}.$$
- Therefore, the last two answers are correct.
(4) Analogously, the lower signal $b_{-1}(t)$ in the same time interval, is characterized by:
- $$b_{\rm -1}(t) = s_0 \cdot \sin (2 \pi \cdot 5/T \cdot t )\cdot 2 \cdot \sin (2 \pi \cdot 3/T \cdot t )= s_0 \cdot \big [ \cos (2 \pi \cdot 2/T \cdot t ) - \cos (2 \pi \cdot 8/T \cdot t )\big ] \hspace{0.05cm}$$
- Answers 1 and 4 are correct.
(5) For the first decision value with $b(t) = b_{+1}(t) - b_{–1}(t)$, it holds that:
- $$E_{1} = \frac{1}{s_0 \cdot T} \cdot \int_{T/2 }^{3T/2} b_{\rm +1} (t )\hspace{0.1cm} {\rm d}t - \frac{1}{s_0 \cdot T} \cdot \int_{T/2 }^{3T/2} b_{\rm -1} (t )\hspace{0.1cm} {\rm d}t\hspace{0.05cm}.$$
- From the result of question (4) , we can see that the second integral yields zero
(Integration over multiples of the period of a sinusoidal functions).
- The first integral is equal to $s_0 · T$. The decision value in the first time interval follows from this: $E_1\hspace{0.15cm}\underline { = +1}$. Similarly, $E_3\hspace{0.15cm}\underline { = +1}$.
- On the other hand, when calculating $E_2$, the first integral is zero and the second has the value $s_0 · T$. Thus, we obtain the value $E_2\hspace{0.15cm}\underline { = -1}$.
