Difference between revisions of "Aufgaben:Exercise 2.1: Two-Dimensional Impulse Response"
| Line 13: | Line 13: | ||
The arrows in the graphic mark different Dirac functions with weights $1$ (red), $1/2$ (blue) and $1/4$ (green). This means that the delay $\tau$ is also discrete here. | The arrows in the graphic mark different Dirac functions with weights $1$ (red), $1/2$ (blue) and $1/4$ (green). This means that the delay $\tau$ is also discrete here. | ||
| − | When measuring the impulse responses at different times $t$ at second | + | When measuring the impulse responses at different times $t$ at intervals of one second, the resolution of the $\tau$ axis was $2$ microseconds $(\delta \tau = 2 \ \rm µ s)$. The echoes were not localized more precisely. |
In this task the following quantities are also referred to: | In this task the following quantities are also referred to: | ||
| − | * the <i>time variant transfer function</i> according to the definition | + | * the <i>time-variant transfer function</i> according to the definition |
:$$H(f,\hspace{0.05cm} t) | :$$H(f,\hspace{0.05cm} t) | ||
\hspace{0.2cm} \stackrel {f,\hspace{0.05cm}{\a6}{\bullet}{\bullet\!-\!-\!-\!-\!-\!\circ} \hspace{0.2cm} h(\dew,\hspace{0.05cm}t) | \hspace{0.2cm} \stackrel {f,\hspace{0.05cm}{\a6}{\bullet}{\bullet\!-\!-\!-\!-\!-\!\circ} \hspace{0.2cm} h(\dew,\hspace{0.05cm}t) | ||
\hspace{0.05cm},$$ | \hspace{0.05cm},$$ | ||
| − | * the approximation of the <i>coherence bandwidth</i> as the reciprocal of the | + | * the approximation of the <i>coherence bandwidth</i> as the reciprocal of the maximal duration of the delay profile $h(\tau, t)$: |
:$$B_{\rm K} \hspace{0.01cm}' = \frac{1}{\frac_{\rm max} - \dew_{\rm min}} | :$$B_{\rm K} \hspace{0.01cm}' = \frac{1}{\frac_{\rm max} - \dew_{\rm min}} | ||
\hspace{0.05cm}.$$ | \hspace{0.05cm}.$$ | ||
Revision as of 13:14, 15 April 2020
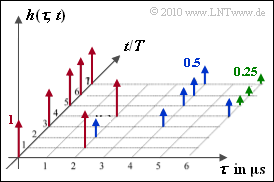
The two-dimensional impulse response $$h(\tau,\hspace{0.05cm}t) = \sum_{m = 1}^{M} z_m(t) \cdot {\rm \delta} (\tau - \tau_m)$$
is to be analyzed according to the adjoining diagram. The two axes are time-discrete:
- $\tau$ is the delay and can take values between $0$ and $6 \ {\rm µ s}$ in the example.
- The (absolute) time $t$ is related to the frequency of snapshots and characterizes the variation of the channel over time. We have $t = n \cdot T$, where $T \gg \tau_{\rm max}$ .
The arrows in the graphic mark different Dirac functions with weights $1$ (red), $1/2$ (blue) and $1/4$ (green). This means that the delay $\tau$ is also discrete here.
When measuring the impulse responses at different times $t$ at intervals of one second, the resolution of the $\tau$ axis was $2$ microseconds $(\delta \tau = 2 \ \rm µ s)$. The echoes were not localized more precisely.
In this task the following quantities are also referred to:
- the time-variant transfer function according to the definition
- $$H(f,\hspace{0.05cm} t) \hspace{0.2cm} \stackrel {f,\hspace{0.05cm}{\a6}{\bullet}{\bullet\!-\!-\!-\!-\!-\!\circ} \hspace{0.2cm} h(\dew,\hspace{0.05cm}t) \hspace{0.05cm},$$
- the approximation of the coherence bandwidth as the reciprocal of the maximal duration of the delay profile $h(\tau, t)$:
- $$B_{\rm K} \hspace{0.01cm}' = \frac{1}{\frac_{\rm max} - \dew_{\rm min}} \hspace{0.05cm}.$$
Notes:
- The task belongs to the topic of the chapter General Description of Time Variant Systems.
- More detailed information on various definitions for the coherence bandwidth can be found in chapter The GWSSUS–Channel Model, especially in the sample solution for the Task 2.7Z.
- It should be noted that this is a constructed task. According to the above graphic, the 2D–impulse response changes significantly during the time span $T$ seriously. Therefore $T$ is to be interpreted here as very large, for example one hour.
- In mobile radio, $h(\tau, t)$ changes in the millisecond range taking into account the Doppler effect, but the changes during this time are rather moderate.
=Questionnaire
Sample solution
{
- This mathematical (two-sided) bandwidth of the low pass–signal is also the maximum physical (one-sided) bandwidth of the corresponding bandpass–signal.
(2) $H(f, t_{\rm 2}) = 1$ means in the time domain $h(\tau, t_{\rm 2}) = \delta(\tau)$.
- Only then the channel is ideal.
- You can see from the graphic that this only applies to the time $t_{\rm 2} \ \underline {= 0}$.
(3) Distortions occur if at time $t$ the impulse response is composed of two or more Dirac functions ⇒ $t ≥ t_{\rm 3} \ \ \underline {\a6}$3T
- At time $t = T$ the signal $s(t)$ is delayed only by $2 \ \rm µ s$.
- At $t = 2T$ the amplitude is additionally reduced by $50 \%$ ($6 \ \ \rm dB$ loss).
(4) At time $t = 3T$ the two Dirac functions occur at $\tau_{\rm min} = 0$ and $\tau_{\rm max} = 4 \ \rm µ s$.
- The (simple approximation for the) coherence bandwidth is the reciprocal of this
$$B_{\rm K}\hspace{0.01cm}' = \frac{1}{4\,\,{\,}{\rm µ s} \hspace{0.25cm} \underline{ = 250\,\,\,{\rm kHz}} \hspace{0.05cm}.$$
- As even at the time $t = 4T$ the Dirac functions are $4 \ \rm µ s$ apart, you also get $B_{\rm K} here \hspace{0.01cm}' = \underline {250 \ \rm kHz}$.
- At $t = 5T$ the impulse response has an extension of $6 \ \ \rm µ s \ \ \Rightarrow \ {\it B}_{\rm K} \hspace{0.01cm}' \ \underline {\approx 166.7 \ \rm kHz}$.
(5) The impulse responses are identical at the times $5T$, $6T$ and $7T$ and consist of 3 diracs each.
- Assuming that nothing changes in this respect for $t ≥ 8T$, you get $t_{\rm 5} \ \ \underline {= 5T}$.
(6) Correct is the solution 2:
- The temporal change of the impulse response, whose dynamics is expressed by the parameter $T$, must be slow in comparison to the maximum expansion of $h(\tau, t)$, which in this task equals $\tau_{\rm max} = 6 \ \rm µ s$: &e.g;
$$T \gg \dew_{\rm max}.$$
