Difference between revisions of "Aufgaben:Exercise 2.3: Yet Another Multi-Path Channel"
| Line 48: | Line 48: | ||
$k_3 \ = \ ${ 0.25 3% } | $k_3 \ = \ ${ 0.25 3% } | ||
| − | {Calculate the frequency response $H(f)$. What is the frequency period $f_0$? <br><i>Note:</i> With integer $i$, it | + | {Calculate the frequency response $H(f)$. What is the frequency period $f_0$? <br><i>Note:</i> With integer $i$, it must hold that $H(f + i \cdot f_0) = H(f)$ . |
|type="{}"} | |type="{}"} | ||
$f_0 \ = \ ${ 500 3% } $\ \ \rm kHz$ | $f_0 \ = \ ${ 500 3% } $\ \ \rm kHz$ | ||
Revision as of 15:07, 15 April 2020
We consider a multipath channel, which is characterized by the following impulse response: $$h(\tau, \hspace{0.05cm} t) = h(\tau) = \sum_{m = 1}^{M} k_m \cdot \delta( \tau - \tau_m) \hspace{0.05cm}.$$
All coefficients $k_{m}$ are real (positive or negative). Furthermore, we note
- From the specification $h(\tau, \hspace{0.05cm}t) = h(\tau)$ you can see that the channel is time invariant.
- Generally, the channel has $M$ paths. The value of $M$ should be determined from the graph.
- The following relations apply to the delay times: $\tau_1 < \tau_2 < \tau_3 < \ \ text{...}$
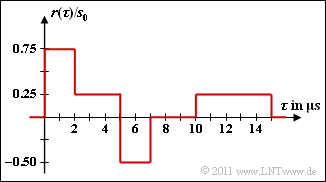
The graph shows the output signal $r(\tau)$ of the channel when the following transmit signal is present at the input (shown in the equivalent low-pass range):
- $$s(\tau) = \left\{ \begin{array}{c} s_0\\ 0 \end{array} \right.\quad \begin{array}{*{1}c} 0 \le \tau < 5\,{\rm µ s}, \\ {\rm otherwise}. \\ \end{array}$$
We want to find the corresponding impulse response $h(\tau)$ as well as the transfer function $H(f)$.
Notes:
- This task refers to the chapter Mehrwegeempfang beim Mobilfunk.
- For the solution of subtask (1) assume that the impulse response $h(\tau)$ has a span of 5 microseconds.
Questionnaire
Sample solution
The sketched output signal $r(\tau)$ can only result if
- $\tau_1 = 0$ (otherwise $r(\tau)$ would not start at $\tau = 0$),
- $\tau_M = 10 \ \ \rm µ s$ is (this results in the rectangular course between $10 \ \ \rm µ s$ and $15 \ \ \rm µ s$),
- in between another Dirac function at $\tau_2 = 2 \ \ \rm µ s$ occurs.
That means: The impulse response here consists of $\underline {M = 3}$ Dirac functions.
(2) As already calculated in the first subtask, one gets
- $$\tau_1 \hspace{0.1cm} \underline {= 0}\hspace{0.05cm},\hspace{0.2cm}\tau_2 \hspace{0.1cm} \underline {= 2\,{\rm µ s}}\hspace{0.05cm},\hspace{0.2cm}\tau_3 \hspace{0.1cm} \underline {= 10\,{\rm µ s}}\hspace{0.05cm}.$$
(3) If you compare input $s(\tau)$ and output $r(\tau)$, you will get the following results:
- Interval $0 < \tau < 2 \ {\rm µ s} \text \ \, s(\tau) = s_0, \hspace{1cm} r(\tau) = 0.75 \cdot s_0 \,\,\Rightarrow\,\, k_1 \ \underline {= 0.75}$,
- Interval $2 \ {\rm µ s} < \tau < 5 \ {\rm µ s} \text \ \, \hspace{2.4cm} r(\tau) =(k_1 + k_2) \cdot s_0 = 0.25 \cdot s_0 \Rightarrow k_2 \ \underline {= \, –0.50}$,
- interval $10 \ {\rm µ s} < \tau < 15 \ {\rm µ s} \text \ \,\hspace{\a6}{\a6} r(\tau} =k_3 \cdot s_0 = 0.25 \cdot s_0 \,\Rightarrow\, k_3 \ \underline {= 0.25}$.
(4) With the displacement theorem one obtains for the Fourier transform of the impulse response $h(\tau)$: $$h(\tau) = k_1 \cdot \delta( \tau) + k_2 \cdot \delta( \tau - \tau_2)+ k_3 \cdot \delta( \tau - \tau_3) \hspace{0.3cm} \Rightarrow \hspace{0.3cm}H(f) = k_1 + k_2 \cdot {\rm e}^{- {\rm j}\cdot 2 \pi f \tau_2}+ k_3 \cdot {\rm e}^{- {\rm j}\cdot 2 \pi f \tau_3} \hspace{0.05cm}. $$
Analysis of the individual contributions leads to the following conclusion:
- The first share is constant ⇒ period $f_1 → ∞$.
- The second share is periodic with $f_2 = 1/\tau_2 = 500 \ \rm kHz$.
- The third portion is periodic with $f_3 = 1/\thaw_3 = 100 \ \rm kHz$.
⇒ In total, $H(f)$ is thus periodic with $f_0 \ \underline {= 500 \ \ \rm kHz}$.
(5) With $A = 2\pi f \cdot \tau_2$ and $B = 2\pi f \cdot \tau_3$ you get
- $$|H(f)|^2 \hspace{-0.1cm} \ = \ \hspace{-0.1cm} H(f) \cdot H^{\star}(f)= \left [ \frac {3}{4} - \frac {1}{2} \cdot {\rm e}^{-{\rm j}A} + \frac {1}{4} \cdot {\rm e}^{-{\rm j}B}\right ] \left [ \frac {3}{4} - \frac {1}{2} \cdot {\rm e}^{{{\rm j}A} + \frac {1}{4} \cdot {\rm e}^{{\rm j}B}\right ]$ $$\Rightarrow \hspace{0.3cm} |H(f)|^2 \hspace{-0.1cm} \ = \ \hspace{-0.1cm} \frac {9}{16}- \frac {3 {\rm e}^{{\rm j}A}}{8} +\frac {3{\rm e}^{{\rm j}B}}{16}
 - \frac {3{\rm e}^{-{\rm j}A}}{8} +\frac {1}{4}- \frac {{\rm e}^{{\rm j}(B-A)}}{8} +\frac {3{\rm e}^{-{\rm j}B}{16}
 - \frac {{{\rm e}^{{{\rm j}(A-B)}}{8} +\frac{1}{16 }=$$
:$$\hspace{2.1cm} \ = \ \hspace{-0.1cm}\frac {7}{8}- \frac {3}{8} \cdot \left [ {\rm e}^{{\rm j}A} + {\rm e}^{-{\rm j}A}\right ]
\frac {3}{16} \cdot \left [ {\rm e}^{{\rm j}B} + {\rm e}^{-{\rm j}B}\right ]- \frac {1}{8} \cdot \left [ {\rm e}^{{{\rm j}(B-A)} + {\rm e}^{-{\rm j}(B-A)}\right ]\hspace{0.05cm}.$ This results in the [[Signal representation/For_calculation_with_complex_numbers#Depiction_by_amount_and_phase|set by Euler]] with consideration of the frequency periodicity: :'"`UNIQ-MathJax36-QINU`"' '"`UNIQ-MathJax37-QINU`"' :'"`UNIQ-MathJax38-QINU`"' '''(6)''' The frequency response just calculated for the frequency $f = 250 \ \rm kHz$ can be displayed as follows: [[File:P_ID2162__Mob_A_2_3e.png|right|frame|Amplitude frequency response for three-way channel]] '"`UNIQ-MathJax39-QINU`"' If you now dial :'"`UNIQ-MathJax40-QINU`"' the result is $|H(f = 250 \ \rm kHz)| = 0$ and thus the most unfavorable value for this signal frequency. The graph shows $|H(f)|$ in the range between $0$ and $500 \ \rm kHz$: *The blue curve applies to $k_3 = 0.25$ according to the specifications of subtask '''(4)''. *The red curve is valid for $k_3 = 1.25$, the most unfavourable value for $f = 250 \ \rm kHz$.
