Difference between revisions of "Aufgaben:Exercise 3.7: Synchronous Demodulator"
m (Text replacement - "Category:Exercises for Signal Representation" to "Category:Signal Representation: Exercises") |
|||
| Line 3: | Line 3: | ||
}} | }} | ||
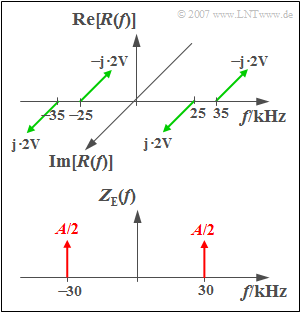
| − | [[File:Sig_A_3_7_version2.png|right|frame| | + | [[File:Sig_A_3_7_version2.png|right|frame|The spectral functions $R(f)$ and $Z_{\rm E}(f)$]] |
To reset an amplitude-modulated signal to the original frequency range, a [[Modulation_Methods/Synchrondemodulation#Blockschaltbild_und_Zeitbereichsdarstellung|synchronous demodulator]] is often used:: | To reset an amplitude-modulated signal to the original frequency range, a [[Modulation_Methods/Synchrondemodulation#Blockschaltbild_und_Zeitbereichsdarstellung|synchronous demodulator]] is often used:: | ||
| Line 56: | Line 56: | ||
By superimposing the two intermediate results and taking into account the low-pass filter, which suppresses the lines at $\pm 55 \text{ kHz}$ and $\pm 65 \text{ kHz}$ , it thus follows for the spectrum of the descent signal: | By superimposing the two intermediate results and taking into account the low-pass filter, which suppresses the lines at $\pm 55 \text{ kHz}$ and $\pm 65 \text{ kHz}$ , it thus follows for the spectrum of the descent signal: | ||
| − | :$$V( f) = - {\rm{j}} \cdot 2\;{\rm{V}} \cdot \delta ( {f - f_{\rm N} }) + {\rm{j}} \cdot 2\;{\rm{V}} \cdot \delta ( {f + f_{\rm N} } )\hspace{0.3cm}{\rm | + | :$$V( f) = - {\rm{j}} \cdot 2\;{\rm{V}} \cdot \delta ( {f - f_{\rm N} }) + {\rm{j}} \cdot 2\;{\rm{V}} \cdot \delta ( {f + f_{\rm N} } )\hspace{0.3cm}{\rm with}\hspace{0.3cm}f_{\rm N} = 5\;{\rm kHz}.$$ |
*The sink signal $v(t)$ is therefore a $5 \text{ kHz}$–sine signal with amplitude $4 \text{ V}$. | *The sink signal $v(t)$ is therefore a $5 \text{ kHz}$–sine signal with amplitude $4 \text{ V}$. | ||
Revision as of 14:45, 27 March 2021
To reset an amplitude-modulated signal to the original frequency range, a synchronous demodulator is often used::
- This multiplies the AM input signal $r(t)$ with a carrier signal $z_{\rm E}(t)$, on the receiving side, which should match the carrier signal $z_{\rm S}(t)$ on the transmitting side with regard to both frequency $f_{\rm T}$ and phase $\varphi_{\rm T}$ .
- This is followed by a rectangular low-pass filter to eliminate all spectral components above the carrier frequency $f_{\rm T}$. We call the output signal of the synchronous demodulator $v(t)$.
The spectrum $R(f)$ of the received signal $r(t)$ sketched above is produced by two-sideband amplitude modulation of a sinusoidal source signal $q(t)$ with the frequency $5\,\text{kHz}$ and the amplitude $8\,\text{V}$ . A cosine signal with the frequency $z_{\rm S}(t)$ was used as the transmission-side carrier signal $30\,\text{kHz}$ verwendet.
The spectrum of the carrier signal $z_{\rm E}(t)$ on the receiving side consists of two dirac lines according to the sketch below, each with the weight $A/2$. Since $z_{\rm E}(t)$ is not to contain a unit, the weights of the dirac functions are also dimensionless.
Hints:
- This exercise belongs to the chapter The Convolution Theorem and Operation.
- Important information can be found on the page Convolution of a Function With a Dirac Function.
Questions
Solution
- Convolution of the spectrum $R(f)$ with the right diracline at $+30 \text{ kHz}$ leads to discrete spectral lines at $-\hspace{-0.08cm}5\, \text{kHz}$, $+5 \,\text{kHz}$, $+55 \,\text{kHz}$ and $+65 \,\text{kHz}$. These are all imaginary and smaller than the impulse weights of $R(f)$ by a factor of $A/2 = 0.5$ kleiner.
- Convolution of $R(f)$ with the Dirac at $-\hspace{-0.08cm}30 \,\text{kHz}$ yields lines at $-\hspace{-0.08cm}65 \,\text{kHz}$, $-55 \,\text{kHz}$, $-5 \,\text{kHz}$ and $+5 \,\text{kHz}$.
By superimposing the two intermediate results and taking into account the low-pass filter, which suppresses the lines at $\pm 55 \text{ kHz}$ and $\pm 65 \text{ kHz}$ , it thus follows for the spectrum of the descent signal:
- $$V( f) = - {\rm{j}} \cdot 2\;{\rm{V}} \cdot \delta ( {f - f_{\rm N} }) + {\rm{j}} \cdot 2\;{\rm{V}} \cdot \delta ( {f + f_{\rm N} } )\hspace{0.3cm}{\rm with}\hspace{0.3cm}f_{\rm N} = 5\;{\rm kHz}.$$
- The sink signal $v(t)$ is therefore a $5 \text{ kHz}$–sine signal with amplitude $4 \text{ V}$.
- The time $t = 50\, µ\text{s}$ corresponds to a quarter of the period $T_0 = 1/f_{\rm N} = 200\, µ\text{s}$.
- Thus the sink signal is maximum here, i.e. $\underline{4 \text{ V}}$.
(2) With $A = 1$ $v(t)$ is only half as large as $q(t)$ ⇒ With $\underline{A = 2}$ both signals would be equal.
(3) The diraclines at $\pm f_{\rm T}$ each have weight $1$. All spectral lines mentioned below are imaginary and equal in magnitude to $2 \text{ V}$.
- The convolution of $R(f)$ with the right diracline of $z_{\rm E}(t)$ yields components at $-\hspace{-0.08cm}4\, \text{kHz (p: positiv)}$, $+6 \,\text{kHz (n: negativ)}$, $+56 \,\text{kHz (p)}$ and $+66 \,\text{kHz (n)}$.
- In contrast, the convolution with the left Dirac function leads to spectral lines at $-\hspace{-0.08cm}66 \,\text{kHz (p)}$, $-\hspace{-0.08cm}56 \,\text{kHz (n)}$, $-\hspace{-0.08cm}6 \,\text{kHz (p)}$ und $+4 \,\text{kHz (n)}$, all also with the (magnitude-related) impulse weights $2 \text{ V}$.
- Taking the low pass into account, only the four spectral lines at $\pm 4 \,\text{kHz}$ and $\pm 6 \,\text{kHz}$.
- The associated time signal is thus with $f_4 = 4 \,\text{kHz}$ and $f_6 = 6 \,\text{kHz}$:
- $$v( t ) = 4\;{\rm{V}} \cdot \sin ( {2{\rm{\pi }}f_4 t} ) + 4\;{\rm{V}} \cdot \sin ( {2{\rm{\pi }}f_6 t} ) \ne q( t ) = 8\;{\rm{V}} \cdot \sin ( {2{\rm{\pi }}f_5 t} ).$$
- At time $t = 50\, µ\text{s}$ one obtains:
- $$v( t = 50\, µ\text{s}) = 4\;{\rm{V}} \cdot \big[ {\sin \big ( {0.4{\rm{\pi }}} ) + \sin ( {0.6{\rm{\pi }}} )} \big]\hspace{0.15 cm}\underline{ = 7.608\;{\rm{V}}}{\rm{.}}$$
