Difference between revisions of "Aufgaben:Exercise 1.2Z: Measurement of the Frequency Response"
| Line 4: | Line 4: | ||
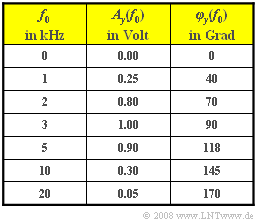
[[File:P_ID788__LZI_Z_1_2.png |right|Measured signal amplitudes <br>and phases for filter $\rm B$|frame]] | [[File:P_ID788__LZI_Z_1_2.png |right|Measured signal amplitudes <br>and phases for filter $\rm B$|frame]] | ||
| − | For the metrological determination of the filter frequency response | + | For the metrological determination of the filter frequency response a sinusoidal input signal with an amplitude of $2 \hspace{0.05cm} \text{V}$ and given frequency $f_0$ is applied. The output signal $y(t)$ or its spectrum $Y(f)$ are then determined according to magnitude and phase. |
*The magnitude spectrum at the output of filter $\rm A$ with frequency $f_0 = 1 \ \text{kHz}$ is: | *The magnitude spectrum at the output of filter $\rm A$ with frequency $f_0 = 1 \ \text{kHz}$ is: | ||
Revision as of 01:56, 29 June 2021
For the metrological determination of the filter frequency response a sinusoidal input signal with an amplitude of $2 \hspace{0.05cm} \text{V}$ and given frequency $f_0$ is applied. The output signal $y(t)$ or its spectrum $Y(f)$ are then determined according to magnitude and phase.
- The magnitude spectrum at the output of filter $\rm A$ with frequency $f_0 = 1 \ \text{kHz}$ is:
- $$|Y_{\rm A} (f)| = 1.6\hspace{0.05cm}{\rm V} \cdot {\rm \delta } (f \pm f_0) + 0.4\hspace{0.05cm}{\rm V} \cdot {\rm \delta } (f \pm 3 f_0) .$$
- For another filter $\rm B$ on the other hand, is always a harmonic oscillation with the (single) frequency $f_0$. For the frequencies $f_0$ given in the table the amplitudes $A_y(f_0)$ and the phases $φ_y(f_0)$ are measured. Here, the following holds:
- $$Y_{\rm B} (f) = {A_y}/{2} \cdot {\rm e}^{ {\rm j} \varphi_y} \cdot {\rm \delta } (f + f_0) + {A_y}/{2} \cdot {\rm e}^{ -{\rm j} \varphi_y} \cdot {\rm \delta } (f - f_0).$$
In the task, filter $\rm B$ should be given in the form:$$H_{\rm B}(f) = {\rm e}^{-a_{\rm B}(f)}\cdot {\rm e}^{-{\rm j} \hspace{0.05cm} \cdot \hspace{0.05cm} b_{\rm B}(f)}.$$
Here,
- $a_{\rm B}(f)$ denotes the damping curve, and
- $b_{\rm B}(f)$ the phase response.
Please note:
- The task belongs to the chapter System Description in Frequency Domain.
Questions
Sample solution
- For an LTI–system, $Y(f) = X(f) · H(f)$ holds.
- Therefore, it is not possible for a component with $3 f_0$ to be present in the output signal if such a one is missing in the input signal.
- This means: There is no LTI–system on hand and accordingly no frequency response can be specified.
(2) Approach 3 is correct.:
- Based on the given numerical values for $A_y(f_0)$ filter $\rm B$ can be assumed to be a band-pass filter.
(3) With $A_x = 2 \text{ V}$ and $\varphi_x = 90^\circ$ (sine function) the following is obtained for $f_0 = f_3 =3 \text{ kHz}$:
- $$H_{\rm B} (f_3) = \frac{A_y}{A_x} \cdot {\rm e}^{ -{\rm j} (\varphi_x - \varphi_y)} = \frac{1\hspace{0.05cm}{\rm V}}{2\hspace{0.05cm}{\rm V}} \cdot {\rm e}^{ -{\rm j} (90^{\circ} - 90^{\circ})} = 0.5.$$
Thus, for $f_0 = f_3 = 3 \text{ kHz}$ the values
- $a_{\rm B} (f_3)\rm \underline{\: ≈ \: 0.693 \: Np}$ and
- $b_{\rm B}(f_3) \rm \underline{\: = \: 0 \: (Grad)}$ are obtained.
(4) Analogously, the frequency response for $f_0 = f_2 =2 \text{ kHz}$ can be determined:
- $$H_{\rm B} ( f_2) = \frac{0.8\hspace{0.05cm}{\rm V}}{2\hspace{0.05cm}{\rm V}} \cdot {\rm e}^{ -{\rm j} (90^{\circ} - 70^{\circ})} = 0.4\cdot {\rm e}^{ -{\rm j} 20^{\circ}}.$$
Hene, for $f_0 = f_2 = 2 \ \text{ kHz}$:
- $a_{\rm B}(f_2) \rm \underline{\: ≈ \: 0.916 \: Np}$ and
- $b_{\rm B}(f_2) \rm \underline{\: = \: 20°}$ are obtained.
For $f_0 = -f_2 =-\hspace{-0.01cm}2 \text{ kHz}$ the same damping value applies. However, the phase has the opposite sign. So, $b_{\rm B}(–f_2) = \ –\hspace{-0.01cm}20^{\circ}.$
