Difference between revisions of "Modulation Methods/Direct-Sequence Spread Spectrum Modulation"
| Line 57: | Line 57: | ||
{{GraueBox|TEXT= | {{GraueBox|TEXT= | ||
[[File:P_ID1874__Mod_T_5_2_S3a_neu.png |right|frame| Signals of direct-sequence spread spectrum modulation in the noise-free case]] | [[File:P_ID1874__Mod_T_5_2_S3a_neu.png |right|frame| Signals of direct-sequence spread spectrum modulation in the noise-free case]] | ||
| − | $\text{Example 1:}$ | + | $\text{Example 1:}$ The graph shows |
| − | + | *above the source signal $q(t)$ – marked by blue background – and the band spread signal $s(t)$ as solid black line, | |
| − | The graph shows | + | *at the bottom left the signal $b(t)$ after band compression, |
| − | *above the source signal $q(t)$ – marked by | ||
| − | *at the bottom left the signal $b(t)$ after band compression, | ||
*bottom right the detection signal $d(t)$ after the integrator, directly before the decision maker. | *bottom right the detection signal $d(t)$ after the integrator, directly before the decision maker. | ||
| − | + | Further notes: | |
| − | # | + | # Discrete-time and normalized signal representation with rectangles spaced by the chip duration $T_c$ is chosen. |
# The spreading factor is $J = 8$. | # The spreading factor is $J = 8$. | ||
# As spreading sequence the [[Modulation_Methods/Spreizfolgen_für_CDMA#Walsh.E2.80.93Funktionen|Walsh function no. 7]] is used. | # As spreading sequence the [[Modulation_Methods/Spreizfolgen_für_CDMA#Walsh.E2.80.93Funktionen|Walsh function no. 7]] is used. | ||
| − | # All images | + | # All images show the noise-free case ⇒ $n(t) = 0$. |
<br clear=all> | <br clear=all> | ||
To the individual signal curves is to be noted: | To the individual signal curves is to be noted: | ||
| − | *The $±1$ data signal $q(t)$ is marked by the blue background. After multiplication with the | + | *The $±1$ data signal $q(t)$ is marked by the blue background. After multiplication with the spreading signal $c(t)$, the result is the transmitted signal $s(t)$ which is higher in frequency by the factor $J = 8$. |
| − | *The | + | *The spreading signal $c(t)$ is periodic with $T = J · T_c$ and thus has a line spectrum. In the data bits $1,\ 4,\ 8$: $s(t)=c(t)$, other times, $s(t) = - c(t)$. |
| − | *After band compression at the receiver, i.e., after chipsynchronous multiplication by $c(t) ∈ \{±1\}$ ⇒ $c^2(t) = 1$ | + | *After band compression at the receiver, i.e., after chipsynchronous multiplication by $c(t) ∈ \{±1\}$ ⇒ $c^2(t) = 1,$ the signal $b(t)$ is obtained. |
| − | *In the distortion-free and noise-free case | + | *In the distortion-free and noise-free case: |
:$$b(t) = r(t) \cdot c(t) = s(t) \cdot c(t) = \big [ q(t) \cdot c(t) \big ] \cdot c(t) = q(t) \hspace{0.05cm}.$$ | :$$b(t) = r(t) \cdot c(t) = s(t) \cdot c(t) = \big [ q(t) \cdot c(t) \big ] \cdot c(t) = q(t) \hspace{0.05cm}.$$ | ||
*Integrating $b(t)$ over one bit at a time yields a linearly increasing or linearly decreasing signal $d(t)$. The step curve in the right image is solely due to the discrete-time representation. | *Integrating $b(t)$ over one bit at a time yields a linearly increasing or linearly decreasing signal $d(t)$. The step curve in the right image is solely due to the discrete-time representation. | ||
| − | *At the equidistant detection times the $ν$–th amplitude coefficients $a_ν$ of the source signal $q(t)$ are valid in the distortion- and noise-free case: | + | *At the equidistant detection times the $ν$–th amplitude coefficients $a_ν$ of the source signal $q(t)$ are valid in the distortion-free and noise-free case: |
:$$ d (\nu T) = \frac{1}{T} \cdot \hspace{-0.1cm} \int_{(\nu -1 )T }^{\nu T}\hspace{-0.3cm} b (t )\hspace{0.1cm} {\rm d}t = a_\nu \in \{ +1, -1 \}\hspace{0.05cm}.$$}} | :$$ d (\nu T) = \frac{1}{T} \cdot \hspace{-0.1cm} \int_{(\nu -1 )T }^{\nu T}\hspace{-0.3cm} b (t )\hspace{0.1cm} {\rm d}t = a_\nu \in \{ +1, -1 \}\hspace{0.05cm}.$$}} | ||
| Line 84: | Line 82: | ||
{{GraueBox|TEXT= | {{GraueBox|TEXT= | ||
[[File:P_ID1867__Mod_T_5_2_S3b_neu.png|right|frame| Signals of direct-sequence spread spectrum modulation for $10 · \lg \ (E_{\rm B}/N_0) = 6 \ {\rm dB}$]] | [[File:P_ID1867__Mod_T_5_2_S3b_neu.png|right|frame| Signals of direct-sequence spread spectrum modulation for $10 · \lg \ (E_{\rm B}/N_0) = 6 \ {\rm dB}$]] | ||
| − | $\text{Example 2:}$ | + | $\text{Example 2:}$ The two lower graphs change significantly from the first example when AWGN noise is considered. |
| − | + | The AWGN parameter is $10 · \lg \ (E_{\rm B}/N_0) = 6 \ \rm dB$. Then | |
| − | |||
| − | The AWGN parameter is | ||
*the band compressed signal $b(t)$ is no longer sectionally constant, and | *the band compressed signal $b(t)$ is no longer sectionally constant, and | ||
*the detection signal $d(t)$ is no longer linearly increasing or decreasing. | *the detection signal $d(t)$ is no longer linearly increasing or decreasing. | ||
| − | After thresholding the samples $d(νT)$, one nevertheless obtains mostly the sought amplitude coefficients. The vague statement "mostly" is quantifiable by the bit error probability $p_{\rm B}$. | + | After thresholding the samples $d(νT)$, one nevertheless obtains mostly the sought amplitude coefficients. The vague statement "mostly" is quantifiable by the bit error probability $p_{\rm B}$. As |
:$$b(t) = \big [ s(t) + n(t) \big ] \cdot c(t) = q(t) + n(t) \cdot c(t)$$ | :$$b(t) = \big [ s(t) + n(t) \big ] \cdot c(t) = q(t) + n(t) \cdot c(t)$$ | ||
and due to the fact that the statistical properties of white noise $n(t)$ are not changed by the multiplication with the $±1$ signal $c(t)$, the same result is obtained again as for the [[Modulation_Methods/Lineare_digitale_Modulation#Fehlerwahrscheinlichkeiten_-_ein_kurzer_.C3.9Cberblick|conventional BPSK]] without band spreading/band compression, independent of the spreading degree $J$ : | and due to the fact that the statistical properties of white noise $n(t)$ are not changed by the multiplication with the $±1$ signal $c(t)$, the same result is obtained again as for the [[Modulation_Methods/Lineare_digitale_Modulation#Fehlerwahrscheinlichkeiten_-_ein_kurzer_.C3.9Cberblick|conventional BPSK]] without band spreading/band compression, independent of the spreading degree $J$ : | ||
Revision as of 17:17, 7 December 2021
Contents
Block diagram and equivalent low-pass model
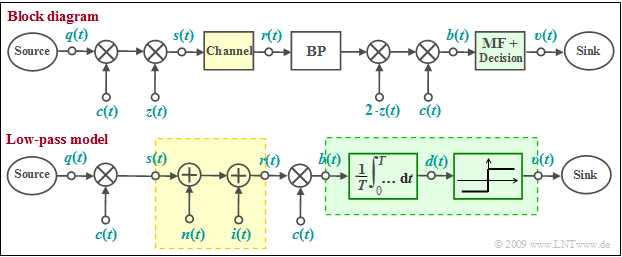
One possibility for realizing a CDMA system is the so-called »Direct-Sequence Spread Spectrum« $\text{(DS–SS)}$ , which is explained here using the block diagram. The corresponding model in the equivalent low-pass range is shown below.
In both models,
- the distortion-free channel $($AWGN and possibly interference from other users, but no intersymbol interference$)$ is highlighted in yellow,
- the optimal receiver $($matched filter plus threshold decider$)$ is highlighted in green.
Note:
In in the equivalent low-pass model the multiplications with the transmitter-side carrier signal $z(t)$ and the receiverer-side carrier signal $z_{\rm E}(t) =2\cdot z(t)$ are omitted.
$\text{This system can be characterized as follows:}$
- If the multiplication with the spreading signal $c(t)$ at transmitter and receiver is omitted, the result is a conventional BPSK system with the carrier $z(t)$ and AWGN noise, characterized by the additive Gaussian noise signal $n(t)$. The second interference component (interference from other participants) is omitted: $i(t) = 0$.
- For the following it is assumed $($this is essential for direct-sequence spread spectrum!$)$ that the source signal $q(t)$ has a rectangular NRZ curve. Then the matched filter can be replaced by an integrator over a symbol duration $T$ ⇒ "Integrate & Dump". This is followed by the threshold decider.
Principle and properties of band spreading methods
In the following we consider Pseudo-Noise Band Spreading in the equivalent low-pass region. So the model outlined below applies.
- Characteristic for this type of modulation is the multiplication of the bipolar and rectangular digital signal $q(t)$ with a pseudo-random $±1$ spreading sequence $c(t)$:
- $$s(t) = q(t) \cdot c(t) \hspace{0.05cm}.$$
- The duration $T_c$ of a spreading chip is smaller than the duration $T$ of a source symbol by the integer spreading factor $J$, so that the transmitted signal spectrum
- $$S(f) = Q(f) \star C(f)$$
- is wider than the spectrum $Q(f)$ by approximately this factor $J$.
$\text{In this context, please note in particular:}$
- In previous chapters, a major goal of modulation has always been to be as bandwidth-efficient as possible.
- Here, in contrast, we try to spread the signal over as wide a bandwidth as possible.
- The bandwidth expansion by $J$ is necessary to allow several subscribers to use the same frequency band simultaneously.
- Ideally, $2^J$ suitable spreading sequences can be found. This makes a CDMA system for $2^J$ simultaneous users feasible.
Band spreading techniques also offer the following advantages:
- An additional low-rate "DS–SS signal" can be transmitted over a frequency band that is otherwise used by FDMA channels with a higher data rate without significantly disrupting the main applications. The band spread signal virtually disappears under the noise level of these signals.
- Targeted narrowband interferers ("sinusoidal interferers") can be combated well with this technique. This military point of view was also decisive for the invention and further development of band spreading techniques.
- Furthermore, the band spreading technique in general, but especially frequency hopping $($fast discrete change of the carrier frequency over a wide range$)$ and chirp modulation $($continuous change of the carrier frequency during a bit interval$)$ also offer the possibility of better transmission over frequency-selective channels.
Signal curves with a single participant
A disadvantage of direct-sequence spread spectrum modulation is that under unfavorable conditions interference can occur between the subscriber under consideration and other subscribers.
- This case is taken into account in the model by the interference quantity $i(t)$.
- We initially consider only one transmitter, so that $i(t) = 0$ is to be set.
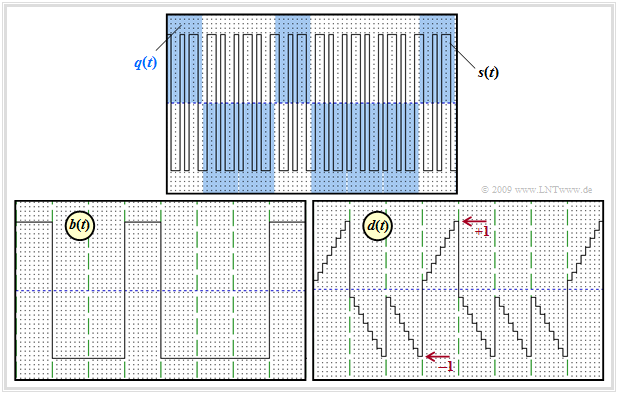
$\text{Example 1:}$ The graph shows
- above the source signal $q(t)$ – marked by blue background – and the band spread signal $s(t)$ as solid black line,
- at the bottom left the signal $b(t)$ after band compression,
- bottom right the detection signal $d(t)$ after the integrator, directly before the decision maker.
Further notes:
- Discrete-time and normalized signal representation with rectangles spaced by the chip duration $T_c$ is chosen.
- The spreading factor is $J = 8$.
- As spreading sequence the Walsh function no. 7 is used.
- All images show the noise-free case ⇒ $n(t) = 0$.
To the individual signal curves is to be noted:
- The $±1$ data signal $q(t)$ is marked by the blue background. After multiplication with the spreading signal $c(t)$, the result is the transmitted signal $s(t)$ which is higher in frequency by the factor $J = 8$.
- The spreading signal $c(t)$ is periodic with $T = J · T_c$ and thus has a line spectrum. In the data bits $1,\ 4,\ 8$: $s(t)=c(t)$, other times, $s(t) = - c(t)$.
- After band compression at the receiver, i.e., after chipsynchronous multiplication by $c(t) ∈ \{±1\}$ ⇒ $c^2(t) = 1,$ the signal $b(t)$ is obtained.
- In the distortion-free and noise-free case:
- $$b(t) = r(t) \cdot c(t) = s(t) \cdot c(t) = \big [ q(t) \cdot c(t) \big ] \cdot c(t) = q(t) \hspace{0.05cm}.$$
- Integrating $b(t)$ over one bit at a time yields a linearly increasing or linearly decreasing signal $d(t)$. The step curve in the right image is solely due to the discrete-time representation.
- At the equidistant detection times the $ν$–th amplitude coefficients $a_ν$ of the source signal $q(t)$ are valid in the distortion-free and noise-free case:
- $$ d (\nu T) = \frac{1}{T} \cdot \hspace{-0.1cm} \int_{(\nu -1 )T }^{\nu T}\hspace{-0.3cm} b (t )\hspace{0.1cm} {\rm d}t = a_\nu \in \{ +1, -1 \}\hspace{0.05cm}.$$
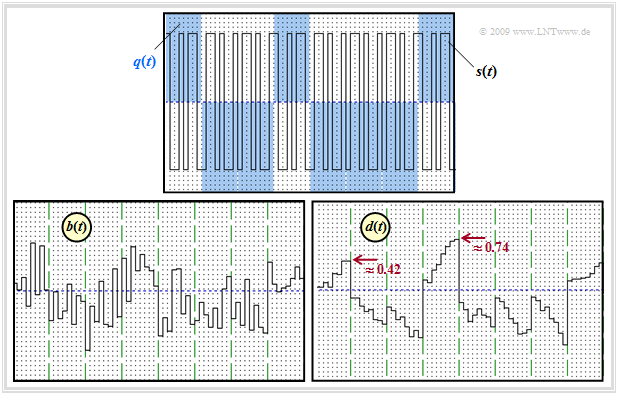
$\text{Example 2:}$ The two lower graphs change significantly from the first example when AWGN noise is considered.
The AWGN parameter is $10 · \lg \ (E_{\rm B}/N_0) = 6 \ \rm dB$. Then
- the band compressed signal $b(t)$ is no longer sectionally constant, and
- the detection signal $d(t)$ is no longer linearly increasing or decreasing.
After thresholding the samples $d(νT)$, one nevertheless obtains mostly the sought amplitude coefficients. The vague statement "mostly" is quantifiable by the bit error probability $p_{\rm B}$. As
- $$b(t) = \big [ s(t) + n(t) \big ] \cdot c(t) = q(t) + n(t) \cdot c(t)$$
and due to the fact that the statistical properties of white noise $n(t)$ are not changed by the multiplication with the $±1$ signal $c(t)$, the same result is obtained again as for the conventional BPSK without band spreading/band compression, independent of the spreading degree $J$ :
- $$p_{\rm B} = {\rm Q} \left( \hspace{-0.05cm} \sqrt { {2 \cdot E_{\rm B} }/{N_{\rm 0} } } \hspace{0.05cm} \right ) \hspace{0.05cm}.$$
Additional sinusoidal interferer around the carrier frequency
We continue to assume only one participant. In contrast to the calculation in the last section, however, there are now
- in addition to the AWGN noise $n(t)$ also
- a narrowband interferer $i(t)$ around the frequency $f_{\rm I}$ with power $P_{\rm I}$ and bandwidth $B_{\rm I}$.
In the limiting case $B_{\rm I} → 0$ the power density spectrum of this "sinusoidal interferer" is:
- $${\it \Phi}_{\rm I}(f) = {P_{\rm I}}/{2} \cdot \big[ \delta ( f - f_{\rm I}) + \delta ( f + f_{\rm I}) \big ] \hspace{0.05cm}.$$
In a conventional transmission system without band spreading/band compression, such a narrowband interferer would increase the error probability to an unacceptable extent. In a system with band spreading ⇒ direct-sequence spread spectrum modulation, the interfering influence is significantly lower, since
- band compression acts as band spreading at the receiver with respect to the sinusoidal interferer,
- thus its power is distributed over a very wide frequency band $B_c = 1/T_c \gg B$,
- the additional interfering power density in the useful frequency band $(±B)$ is rather low and can be detected by a slight increase of the AWGN noise power density $N_0$.
With $T = J · T_c$ and $B = 1/T$ one obtains:
- $$p_{\rm B} \approx {\rm Q} \left( \hspace{-0.05cm} \sqrt { \frac{2 \cdot E_{\rm B}}{N_{\rm 0} +P_{\rm I} \cdot T_c} } \hspace{0.05cm} \right ) = {\rm Q} \left( \hspace{-0.05cm} \sqrt { \frac{2 \cdot E_{\rm B}}{N_{\rm 0} } \cdot \left( \frac{1}{1+ P_{\rm I} \cdot T_c/N_0}\right ) } \hspace{0.05cm} \right )\hspace{0.3cm}\Rightarrow \hspace{0.3cm}\text{SNR degradation:} \ \frac{1}{\big[1 + P_{\rm I}/(J · N_0 · B)\big]}\hspace{0.05cm}.$$
The larger the spreading factor $J$, the smaller the increase in noise power due to the sinusoidal interferer.
Note: This fact has led to the spreading factor $J$ being often referred to as spreading gain in the literature, compare for example [ZP85][1].
- These books are mostly about military applications of the band spreading methods.
- Sometimes the "cheapest interferer" is mentioned, namely when the degradation is the largest.
- However, we do not want to deal with such applications here.
Approximately, however, the above error probability equation can also be applied when an unspread transmission of higher data rate and a spread spectrum system of lower rate operate in the same frequency band. The interfering influence of the former system with bandwidth $B_{\rm I}$ on the spread spectrum system can be treated approximately as a narrowband interferer as long as $B_{\rm I}$ is sufficiently small.
$\text{Conclusion:}$
- With AWGN noise (and also many other channels), the bit error probability cannot be reduced by band spreading.
- In the best case, band spreading results in the same bit error probability as BPSK (without spreading).
- For our purposes, band spreading is a necessary measure to be able to supply several subscribers simultaneously in the same frequency band.
- In the following, we will only consider the CDMA aspect and therefore continue to speak of the spreading factor $J$ and not of a spreading gain.
Exercises for the chapter
Exercise 5.2: Bandspreading and Narrowband Interferer
Exercise 5.2Z: About PN Modulation
References
- ↑ Ziemer, R.; Peterson, R. L.: Digital Communication and Spread Spectrum Systems. New York: McMillon, 1985.


