Aufgaben:Exercise 5.1: Sampling Theorem: Difference between revisions

From LNTwww
Fix interlanguage link: resolve redirect chain
 
(24 intermediate revisions by 6 users not shown)
Line 1: Line 1:


{{quiz-Header|Buchseite=Signaldarstellung/Zeitdiskrete Signaldarstellung
{{quiz-Header|Buchseite=Signal_Representation/Time_Discrete_Signal_Representation
}}
}}


[[File:P_ID1126__Sig_A_5_1.png|right|Abtasttheorem]]
[[File:P_ID1126__Sig_A_5_1.png|right|frame|Sampling of an analog signal  $x(t)$]]


Gegeben ist ein Analogsignal $x(t)$ entsprechend der Skizze.
Given is an analog signal  $x(t)$  according to the sketch:
*Bekannt ist, dass dieses Signal keine höheren Frequenzen als $B_{\rm NF} = 4 \ \text{kHz}$ beinhaltet.  
*It is known that this signal does not contain any frequencies higher than  $B_{\rm NF} = 4 \ \text{kHz}$.  
*Durch Abtastung mit der Abtastrate $f_{\rm A}$ erhält man das in der Grafik rot eingezeichnete Signal $x_{\rm A}(t)$.
*By sampling with the sampling rate  $f_{\rm A}$ , the signal  $x_{\rm A}(t)$ sketched in red in the diagram is obtained.
*Zur Signalrekonstruktion wird ein Tiefpass verwendet, für dessen Frequenzgang gilt:
*For signal reconstruction a low-pass filter is used, for whose frequency response applies:
   
   
:$$H(f)  = \left\{ \begin{array}{c} 1  \\
:$$H(f)  = \left\{ \begin{array}{c} 1  \\0  \\  \end{array} \right.\quad\begin{array}{*{5}c} {\rm{{\rm{f\ddot{u}r}}}}\\ {\rm{{\rm{f\ddot{u}r}}}}  \\ \end{array}\begin{array}{*{5}c}|f| < f_1 \hspace{0.05cm}, \\|f| > f_2  \hspace{0.05cm} \\\end{array}$$
0  \\  \end{array} \right.\quad
\begin{array}{*{5}c} {\rm{{\rm{f\ddot{u}r}}}}
\\ {\rm{{\rm{f\ddot{u}r}}}}  \\ \end{array}\begin{array}{*{5}c}
|f| < f_1 \hspace{0.05cm}, \\
|f| > f_2  \hspace{0.05cm} \\
\end{array}$$


Der Bereich zwischen den Frequenzen $f_1$ und $f_2 > f_1$ ist für die Lösung dieser Aufgabe nicht relevant.
The range between the frequencies&nbsp; $f_1$&nbsp; and&nbsp; $f_2 > f_1$&nbsp; is not relevant for the solution of this task.


Die Eckfrequenzen $f_1$ und $f_2$ sind so zu bestimmen, dass das Ausgangssignal $y(t)$ des Tiefpasses mit dem Signal $x(t)$ exakt übereinstimmt.
The corner frequencies&nbsp; $f_1$&nbsp; and&nbsp; $f_2$&nbsp; are to be determined in such a way that the output signal&nbsp; $y(t)$&nbsp; of the low-pass filter exactly matches the signal&nbsp; $x(t)$&nbsp;.


''Hinweise:''
*Die Aufgabe gehört zum  Kapitel [[Signaldarstellung/Zeitdiskrete_Signaldarstellung|Zeitdiskrete Signaldarstellung]].
*Sollte die Eingabe des Zahlenwertes &bdquo;0&rdquo; erforderlich sein, so geben Sie bitte &bdquo;0.&rdquo; ein.
*Zu der hier behandelten Thematik gibt es auch ein Interaktionsmodul:
:[[Abtastung periodischer Signale und Signalrekonstruktion]]


===Fragebogen===


''Hints:''
*This task belongs to the chapter&nbsp; [[Signal_Representation/Time_Discrete_Signal_Representation|Discrete-Time Signal Representation]].
*There is an interactive applet for the topic dealt with here: &nbsp;[[Applets:Sampling_of_Analog_Signals_and_Signal_Reconstruction|Sampling of Analog Signals and Signal Reconstruction]]
 
 
===Questions===


<quiz display=simple>
{Ermitteln Sie aus der Grafik die zugrundeliegende Abtastrate.
{Determine the underlying sampling rate from the graph.
|type="{}"}
|type="{}"}
$f_{\rm A}$ &nbsp; = { 10 3% } &nbsp;$\text{kHz}$
$f_{\rm A}\ = \ $ { 10 3% } &nbsp;$\text{kHz}$


{Bei welchen Frequenzen besitzt die Spektralfunktion $X_{\rm A}(f)$ mit Sicherheit keine Anteile?
{At which frequencies does the spectral function&nbsp; $X_{\rm A}(f)$&nbsp; have <u>no components</u> with certainty?
|type="[]"}
|type="[]"}
- $f =  2.5 \ \text{kHz},$
+ $f=  5.5 \text{kHz},$
+ $f=  5.5 \ \text{kHz},$
- $f=  6.5 \text{kHz},$
- $f=  6.5 \ \text{kHz},$
+ $f=  34.5 \text{kHz}.$
+ $f=  34.5 \ \text{kHz}.$


{Wie groß muss die untere Eckfrequenz $f_1$ mindestens sein, damit das Signal perfekt rekonstruiert wird?
{What is the minimum size of the lower cut-off frequency&nbsp; $f_1$&nbsp; that the signal is perfectly reconstructed?
|type="{}"}
|type="{}"}
$f_{1,\ \text{min}}$ &nbsp; = { 4 3% } &nbsp;$\text{kHz}$
$f_{1,\ \text{min}}\ = \ ${ 4 3% } &nbsp;$\text{kHz}$


{Wie groß darf die obere Eckfrequenz $f_2$ höchstens sein, damit das Signal perfekt rekonstruiert wird?
{What is the maximum size of the upper corner frequency&nbsp; $f_2$&nbsp; that the signal is perfectly reconstructed?
|type="{}"}
|type="{}"}
$f_{2,\ \text{max}}$ &nbsp; = { 6 3% } &nbsp;$\text{kHz}$
$f_{2,\ \text{max}}\ = \ ${ 6 3% } &nbsp;$\text{kHz}$


</quiz>
</quiz>


===Musterlösung===
===Solution===
{{ML-Kopf}}
{{ML-Kopf}}
'''1.''' Der Abstand zweier benachbarter Abtastwerte beträgt $T_{\rm A} = 0.1 \ \text{ms}$. Somit erhält man für die Abtastrate $f_{\rm A} = 1/ T_{\rm A} \;\underline {= 10 \ \text{kHz}}$.
'''(1)'''&nbsp;  The distance between two adjacent samples is&nbsp; $T_{\rm A} = 0.1 \ \text{ms}$.&nbsp; Thus, for the sampling rate&nbsp; $f_{\rm A} = 1/ T_{\rm A} \;\underline {= 10 \ \text{kHz}}$is obtained.
 
'''2.'''  Das Spektrum $X_{\rm A}(f)$ des abgetasteten Signals erhält man aus $X(f)$ durch periodische Fortsetzung im Abstand $f_{\rm A} =  10 \ \text{kHz}$. Aus der Skizze erkennt man, dass $X_{\rm A}(f)$ durchaus Anteile bei $f =  2.5 \ \text{kHz}$ und  $f =  6.5 \ \text{kHz}$besitzen kann, nicht jedoch bei  $f =  5.5 \ \text{kHz}$. Auch bei  $f =  34.5 \ \text{kHz}$ wird $X_{\rm A}(f)$ = 0 auf jeden Fall gelten. Richtig sind also die <u>Lösungsvorschläge 2 und 4</u>.


[[File:P_ID1127__Sig_A_5_1_b.png|450px|center|Zum Abtasttheorem]]


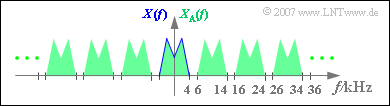
[[File:P_ID1127__Sig_A_5_1_b.png|450px|right|frame|Spectrum&nbsp; $X_{\rm A}(f)$&nbsp; of the sampled signal <br>(schematic representation)]]
'''(2)'''&nbsp;  Proposed <u>solutions 2 and 4</u> are correct:
*The spectrum&nbsp; $X_{\rm A}(f)$&nbsp; of the sampled signal is obtained from&nbsp; $X(f)$&nbsp; by periodic continuation at a distance of&nbsp; $f_{\rm A} =  10 \ \text{kHz}$.
*From the sketch you can see that&nbsp; $X_{\rm A}(f)$&nbsp; can have signal parts at&nbsp; $f =  2.5 \ \text{kHz}$&nbsp; and&nbsp;  $f =  6.5 \ \text{kHz}$;.
*In contrast, there are no components at&nbsp;  $f =  5.5 \ \text{kHz}$.
*Also at&nbsp;  $f =  34.5 \ \text{kHz}$&nbsp; will be valid&nbsp; $X_{\rm A}(f) = 0$.
<br clear=all>
'''(3)'''&nbsp; It must be ensured that all frequencies of the analog signal are weighted with&nbsp; $H(f) = 1$.
*From this follows according to the sketch:


'''3.'''  Es muss sichergestellt sein, dass alle Frequenzen des Analogsignals mit $H(f) = 1$ bewertet werden. Daraus folgt entsprechend der siehe Skizze:
:$$f_{1, \ \text{min}} = B_{\rm NF} \;\underline{= 4 \ \text{kHz}}.$$


$$f_{1, \ \text{min}} = B_{\rm NF} \;\underline{= 4 \ \text{kHz}}.$$


'''4.''' Ebenso muss garantiert werden, dass alle Spektralanteile von $X_{\rm A}(f)$, die in $X(f)$ nicht enthalten sind, durch den Tiefpass entfernt werden. Entsprechend der Skizze gilt:
'''(4)'''&nbsp; Likewise, it must be guaranteed that all spectral components of&nbsp; $X_{\rm A}(f)$, that are not contained in&nbsp; $X(f)$&nbsp; are removed by the low-pass filter.
*According to the sketch, the following must apply:


$$f_{2, \ \text{max}} = f_{\rm A} – B_{\rm NF} \;\underline{= 6 \ \text{kHz}}.$$
:$$f_{2, \ \text{max}} = f_{\rm A} – B_{\rm NF} \;\underline{= 6 \ \text{kHz}}.$$
{{ML-Fuß}}
{{ML-Fuß}}


__NOEDITSECTION__
__NOEDITSECTION__
[[Category:Aufgaben zu Signaldarstellung|^5. Zeit- und frequenzdiskrete Signaldarstellung^]]
[[Category:Signal Representation: Exercises|^5.1 Discrete-Time Signal Representation^]]
[[de:Aufgaben:Aufgabe 5.1: Zum Abtasttheorem]]

Latest revision as of 17:53, 16 March 2026

Sampling of an analog signal  $x(t)$

Given is an analog signal  $x(t)$  according to the sketch:

  • It is known that this signal does not contain any frequencies higher than  $B_{\rm NF} = 4 \ \text{kHz}$.
  • By sampling with the sampling rate  $f_{\rm A}$ , the signal  $x_{\rm A}(t)$ sketched in red in the diagram is obtained.
  • For signal reconstruction a low-pass filter is used, for whose frequency response applies:
$$H(f) = \left\{ \begin{array}{c} 1 \\0 \\ \end{array} \right.\quad\begin{array}{*{5}c} {\rm{{\rm{f\ddot{u}r}}}}\\ {\rm{{\rm{f\ddot{u}r}}}} \\ \end{array}\begin{array}{*{5}c}|f| < f_1 \hspace{0.05cm}, \\|f| > f_2 \hspace{0.05cm} \\\end{array}$$

The range between the frequencies  $f_1$  and  $f_2 > f_1$  is not relevant for the solution of this task.

The corner frequencies  $f_1$  and  $f_2$  are to be determined in such a way that the output signal  $y(t)$  of the low-pass filter exactly matches the signal  $x(t)$ .


Hints:


Questions

1 Determine the underlying sampling rate from the graph.

$f_{\rm A}\ = \ $  $\text{kHz}$

2 At which frequencies does the spectral function  $X_{\rm A}(f)$  have no components with certainty?

$f = 2.5 \ \text{kHz},$
$f= 5.5 \ \text{kHz},$
$f= 6.5 \ \text{kHz},$
$f= 34.5 \ \text{kHz}.$

3 What is the minimum size of the lower cut-off frequency  $f_1$  that the signal is perfectly reconstructed?

$f_{1,\ \text{min}}\ = \ $  $\text{kHz}$

4 What is the maximum size of the upper corner frequency  $f_2$  that the signal is perfectly reconstructed?

$f_{2,\ \text{max}}\ = \ $  $\text{kHz}$


Solution

(1)  The distance between two adjacent samples is  $T_{\rm A} = 0.1 \ \text{ms}$.  Thus, for the sampling rate  $f_{\rm A} = 1/ T_{\rm A} \;\underline {= 10 \ \text{kHz}}$is obtained.


Spectrum  $X_{\rm A}(f)$  of the sampled signal
(schematic representation)

(2)  Proposed solutions 2 and 4 are correct:

  • The spectrum  $X_{\rm A}(f)$  of the sampled signal is obtained from  $X(f)$  by periodic continuation at a distance of  $f_{\rm A} = 10 \ \text{kHz}$.
  • From the sketch you can see that  $X_{\rm A}(f)$  can have signal parts at  $f = 2.5 \ \text{kHz}$  and  $f = 6.5 \ \text{kHz}$;.
  • In contrast, there are no components at  $f = 5.5 \ \text{kHz}$.
  • Also at  $f = 34.5 \ \text{kHz}$  will be valid  $X_{\rm A}(f) = 0$.


(3)  It must be ensured that all frequencies of the analog signal are weighted with  $H(f) = 1$.

  • From this follows according to the sketch:
$$f_{1, \ \text{min}} = B_{\rm NF} \;\underline{= 4 \ \text{kHz}}.$$


(4)  Likewise, it must be guaranteed that all spectral components of  $X_{\rm A}(f)$, that are not contained in  $X(f)$  are removed by the low-pass filter.

  • According to the sketch, the following must apply:
$$f_{2, \ \text{max}} = f_{\rm A} – B_{\rm NF} \;\underline{= 6 \ \text{kHz}}.$$