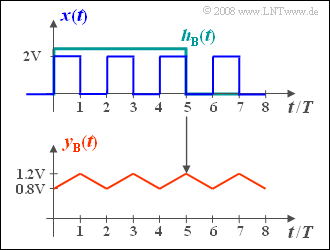
[[File:P_ID834__LZI_Z_1_4.png |right|Periodisches Rechtecksignal und Rechteckfilter (Aufgabe Z1.4)]]
[[File:P_ID834__LZI_Z_1_4.png |right|frame|Periodic rectangular signal and <br>filter with rectangular impulse response]]
Wir betrachten das periodische Rechtecksignal $x(t)$ gemäß obiger Skizze, dessen Periodendauer $T_0 = 2T$ ist. Dieses Signal besitzt Spektralanteile bei der Grundfrequenz $f_0 = 1/T_0 = 1/(2T)$ und allen ungeradzahligen Vielfachen davon, d.h. bei $3f_0, 5f_0,$ usw. Zusätzlich gibt es einen Gleichanteil.
We consider the periodic rectangular signal $x(t)$ , whose periodic duration is $T_0 = 2T$ , according to the sketch above.
Dazu betrachten wir zwei Filter A und B mit jeweils rechteckförmiger Impulsantwort $h_{\rm A}(t)$ mit Dauer $6T$ bzw. $h_{\rm B}(t)$ mit der Dauer $5T$. Die Höhen der beiden Impulsantworten sind so gewählt, dass die Flächen der Rechtecke jeweils 1 ergeben.
*This signal has spectral components at the fundamental frequency $f_0 = 1/T_0 = 1/(2T)$ and at all odd multiples thereof, that is, at $3f_0$, $5f_0,$ and so on. In addition, there is a direct component.
'''Hinweis:''' Die Aufgabe bezieht sich auf den Theorieteil von [[Lineare_zeitinvariante_Systeme/Systembeschreibung_im_Zeitbereich|Kapitel 1.2]]. Informationen zur Faltung finden Sie im [[Signaldarstellung/Faltungssatz_und_Faltungsoperation|Kapitel 3.4]] des Buches „Signaldarstellung”.
*For this purpose, we consider two filters $\rm A$ and $\rm B$ each with rectangular impulse response $h_{\rm A}(t)$ with duration $6T$ and $h_{\rm B}(t)$ with duration $5T$, respectively.
*The heights of the two impulse responses are such that the areas of the rectangles each add up to $1$ .
===Fragebogen===
''Please note:''
*The exercise belongs to the chapter [[Linear_and_Time_Invariant_Systems/System_Description_in_Time_Domain|System Description in Time Domain]].
*For information on convolution, see the chapter [[Signal_Representation/The_Convolution_Theorem_and_Operation|convolution theorem and operation]] in the book "Signal Representation”.
*We also refer you to the interactive applet [[Applets:Zur_Verdeutlichung_der_grafischen_Faltung|Zur Verdeutlichung der graphischen Faltung]].
===Questions===
<quiz display=simple>
<quiz display=simple>
{Berechnen Sie das Ausgangssignal $y_{\rm A}(t)$ von Filter A, insbesondere die Werte bei $t = 0$ und $t = T$.
{Compute the output signal $y_{\rm A}(t)$ of the filter $\rm A$, in particular the values at $t = 0$ and $t = T$.
|type="{}"}
|type="{}"}
$y_{\rm A}(t = 0) =$ { 1 } V
$y_{\rm A}(t = 0) \ =\ $ { 1 3% } $\rm V$
$y_{\rm A}(t = T) =$ { 1 } V
$y_{\rm A}(t = T) \ =\ $ { 1 3% } $\rm V$
{Geben Sie die Betragsfunktion $|H_{\rm A}(f)|$ an. Welcher Wert ergibt sich bei der Frequenz $f = f_0$? Interpretieren Sie das Ergebnis der Teilaufgabe 1).
{Give the absolute value function $|H_{\rm A}(f)|$ . What value is obtained at frequency $f = f_0$? <br>Interpret the result of the subtask '''(1)'''.
|type="{}"}
|type="{}"}
$|H_{\rm A}(f = f_0)| =$ { 0 }
$|H_{\rm A}(f = f_0)| \ =\ $ { 0. }
{Berechnen Sie das Ausgangssignal $y_{\rm B}(t)$ von Filter B, insbesondere die Werte bei $t = 0$ und $t = T$.
{Compute the output signal $y_{\rm B}(t)$ of the filter $\rm B$, in particular the values at $t = 0$ and $t = T$.
|type="{}"}
|type="{}"}
$y_{\rm B}(t = 0) =$ { 0.8 } V
$y_{\rm B}(t = 0) \ =\ $ { 0.8 3% } $\rm V$
$y_{\rm B}(t = T) =$ { 1.2 } V
$y_{\rm B}(t = T) \ =\ $ { 1.2 3% } $\rm V$
{Wie lautet die Betragsfunktion $|H_{\rm B}(f)|$, insbesondere bei den Frequenzen $f = f_0$ und $f = 3 · f_0$? Interpretieren Sie damit das Ergebnis von 3).
{What is the absolute value function $|H_{\rm B}(f)|$, especially at frequencies $f = f_0$ and $f = 3 · f_0$? <br>Use this to interpret the result of the subtask '''(3)'''.
|type="{}"}
|type="{}"}
$|H_{\rm B}(f = f_0)| =$ { 0.127 5% }
$|H_{\rm B}(f = f_0)| \ =\ $ { 0.127 5% }
$|H_{\rm B}(f = 3f_0)| =$ { 0.042 5% }
$|H_{\rm B}(f = 3f_0)| \ =\ $ { 0.042 5% }
</quiz>
</quiz>
===Musterlösung===
===Solution===
{{ML-Kopf}}
{{ML-Kopf}}
'''1.''' Das Ausgangssignal ist das Ergebnis der Faltungsoperation zwischen $x(t)$ und $h_{\rm A}(t)$:
'''(1)''' The output signal is the result of the convolution operation between $x(t)$ and $h_{\rm A}(t)$:
Man erkennt, dass diese Gleichung für alle $t$ das gleiche Ergebnis $y_{\rm A}(t) \rm \underline{\: = 1V}$ liefert.
*It can be seen that this equation gives the same result $y_{\rm A}(t) \rm \underline{\: = 1V}$ for all $t$ .
'''2.''' Der Betragsfrequenzgang lautet:
'''(2)''' The magnitude of the frequency response is $|H_{\rm A}(f)| = |{\rm si}(\pi \cdot f \cdot 6T)|.$ This has zeros at an interval of $1/(6T)$ .
$$|H_{\rm A}(f)| = |{\rm si}(\pi \cdot f \cdot 6T)|.$$
*So, there are also zeros at $f_0$, $3f_0$, $5f_0$ etc., respectively.
Dieser weist Nullstellen im Abstand $1/(6T)$ auf. Somit liegen auch bei $f_0, 3f_0, 5f_0$ usw. jeweils Nullstellen vor. Insbesondere gilt auch: $|H_{\rm A}(f = f_0)| \underline{\: = 0}$. Vom Spektrum $X(f)$ bleibt somit nur der Gleichanteil 1V unverändert erhalten. Dagegen sind alle anderen Spektrallinien in $Y_{\rm A}(f)$ nicht mehr enthalten.
*From the spectrum $X(f)$ only the direct component $1 \hspace{0.05cm} \rm V$ remains unchanged.
*In contrast to this, all other spectral lines in $Y_{\rm A}(f)$ are no longer included.
'''3.''' [[File:P_ID836__LZI_Z_1_4_c.png | Grafische Verdeutlichung der Faltungsoperation (ML zu Aufgabe Z1.4c) | rechts]] Analog zur Teilaufgabe 1) kann hier für das Ausgangssignal geschrieben werden:
[[File:P_ID836__LZI_Z_1_4_c.png | Graphical illustration of the convolution operation| rechts|frame]]
'''(3)''' Analogous to the subtask '''(1)''' for the output signal the following can be recorded:
Es ergibt sich nun ein um den Mittelwert 1V schwankender dreieckförmiger Verlauf, wie aus der unteren Grafik zu ersehen ist. Zu den Zeiten $t = 0, t = 2T, t = 4T, ...$ ist
*This results in a triangular shape fluctuating around the mean $1 \ \rm V$ ⇒ see bottom graph.
da jeweils zwei Rechtecke und drei Lücken ins Integrationsintervall fallen. Dagegen sind bei $t = T, 3T, 5T,$ usw. jeweils drei Rechtecke und zwei Lücken zu berücksichtigen, und man erhält $y_{\rm B}(t) \rm \underline{\: = 1.2 \: V}$.
*Since two rectangles and three gaps each are covered by the integration interval, the following holds for $t = 0, t = 2T,$ etc.:
Die Spektralanteile des Rechtecksignals bei $f_0, 3f_0,$ usw. werden zwar nun nicht mehr unterdrückt, aber mit steigender Frequenz immer mehr abgeschwächt und zwar in der Form, dass der Rechteckverlauf in ein periodisches Dreiecksignal gewandelt wird. Der Gleichanteil bleibt auch hier unverändert.
'''(4)''' The magnitude function is generally or at frequencies $f = f_0 = 1/(2T)$ and $f = 3f_0$:
Beide Filter liefern also den Mittelwert des Eingangssignals. Beim vorliegenden Signal $x(t)$ ist für die Bestimmung des Mittelwertes das Filter A besser geeignet als das Filter B, da bei Ersterem die Länge der Impulsantwort ein Vielfaches der Periodendauer $T_0 = 2T$ ist. Ist diese Bedingung – wie beim Filter B – nicht erfüllt, so überlagert sich dem Mittelwert noch ein (in diesem Beispiel dreieckförmiges) Fehlersignal.
Interpretation:
*The spectral components of the rectangular signal at $f_0, 3f_0,$ etc., although now no longer suppressed, are increasingly attenuated as the frequency increases, in such a way that the rectangular curve is converted into a periodic triangular signal. The direct component $(1 \hspace{0.05cm} \rm V)$ remains unchanged here, too.
*Thus, both filters provide the average value of the input signal. For the signal $x(t)$ at hand the filter $\rm A$ is more suitable than the filter $\rm B$ for the determination of the mean value, because for the former the length of the impulse response is a multiple of the period $T_0 = 2T$ .
*If this condition – as with the filter $\rm B$ – is not fulfilled, an error signal (triangular in this example) is still superimposed on the mean value.
{{ML-Fuß}}
{{ML-Fuß}}
Line 69:
Line 91:
[[Category:Aufgaben zu Lineare zeitinvariante Systeme|^1.2 Systembeschreibung im Zeitbereich^]]
[[Category:Linear and Time-Invariant Systems: Exercises|^1.2 System Description in Time Domain^]]
[[de:Aufgaben:Aufgabe 1.4Z: Alles rechteckförmig]]
Periodic rectangular signal and filter with rectangular impulse response
We consider the periodic rectangular signal $x(t)$ , whose periodic duration is $T_0 = 2T$ , according to the sketch above.
This signal has spectral components at the fundamental frequency $f_0 = 1/T_0 = 1/(2T)$ and at all odd multiples thereof, that is, at $3f_0$, $5f_0,$ and so on. In addition, there is a direct component.
For this purpose, we consider two filters $\rm A$ and $\rm B$ each with rectangular impulse response $h_{\rm A}(t)$ with duration $6T$ and $h_{\rm B}(t)$ with duration $5T$, respectively.
The heights of the two impulse responses are such that the areas of the rectangles each add up to $1$ .
The spectral components of the rectangular signal at $f_0, 3f_0,$ etc., although now no longer suppressed, are increasingly attenuated as the frequency increases, in such a way that the rectangular curve is converted into a periodic triangular signal. The direct component $(1 \hspace{0.05cm} \rm V)$ remains unchanged here, too.
Thus, both filters provide the average value of the input signal. For the signal $x(t)$ at hand the filter $\rm A$ is more suitable than the filter $\rm B$ for the determination of the mean value, because for the former the length of the impulse response is a multiple of the period $T_0 = 2T$ .
If this condition – as with the filter $\rm B$ – is not fulfilled, an error signal (triangular in this example) is still superimposed on the mean value.