Difference between revisions of "Aufgaben:Exercise 2.1: Rectification"
From LNTwww
| (11 intermediate revisions by 3 users not shown) | |||
| Line 2: | Line 2: | ||
{{quiz-Header|Buchseite=Signal Representation/General Description | {{quiz-Header|Buchseite=Signal Representation/General Description | ||
}} | }} | ||
| − | [[File:P_ID239__Sig_A_2_1.png|250px|right|frame| | + | [[File:P_ID239__Sig_A_2_1.png|250px|right|frame|Periodic triangular signal]] |
| − | The graph shows the periodic signal $x(t)$. If $x(t)$ is applied to the input of a non-linearity with the characteristic curve | + | The graph shows the periodic signal $x(t)$. If $x(t)$ is applied to the input of a non-linearity with the characteristic curve |
:$$y=g(x)=\left\{ {x \; \rm for\; \it x \geq \rm 0, \atop {\rm 0 \;\;\; \rm else,}}\right.$$ | :$$y=g(x)=\left\{ {x \; \rm for\; \it x \geq \rm 0, \atop {\rm 0 \;\;\; \rm else,}}\right.$$ | ||
| − | the | + | the signal $y(t)$ is obtained at the output. A second non-linear characteristic |
:$$z=h(x)=|x|$$ | :$$z=h(x)=|x|$$ | ||
| Line 19: | Line 19: | ||
| − | '' | + | ''Note:'' |
*This exercise belongs to the chapter [[Signal_Representation/General_Description|General description of periodic signals]]. | *This exercise belongs to the chapter [[Signal_Representation/General_Description|General description of periodic signals]]. | ||
| Line 40: | Line 40: | ||
| − | {What is the period $T_0$ of the signal $y(t)$? | + | {What is the period duration $T_0$ of the signal $y(t)$? |
|type="{}"} | |type="{}"} | ||
$T_0 \ = \ $ { 2 3% } $\text{ms}$ | $T_0 \ = \ $ { 2 3% } $\text{ms}$ | ||
| − | {What is the | + | {What is the basic circular frequency $\omega_0$ of the signal $z(t)$? |
|type="{}"} | |type="{}"} | ||
$\omega_0 \ = \ $ { 6283 3% } $\text{1/s}$ | $\omega_0 \ = \ $ { 6283 3% } $\text{1/s}$ | ||
| Line 53: | Line 53: | ||
===Solution=== | ===Solution=== | ||
{{ML-Kopf}} | {{ML-Kopf}} | ||
| − | '''(1)''' | + | '''(1)''' Correct are the <u>solutions 1 and 4</u>: |
| − | * | + | *The non-linear characteristic $y = g(x)$ describes a half-wave rectifier. |
| − | *$z = h(x) = |x|$ | + | *$z = h(x) = |x|$ describes a full-wave rectifier. |
| − | '''(2)''' | + | '''(2)''' The period duration $x(t)$ is $T_0 = 2\,\text{ms}$. The inverse magnitudes to the base frequency $f_0 \hspace{0.1cm}\underline{ = 500\,\text{Hz}}$. |
| − | '''(3)''' | + | '''(3)''' The half-wave rectification does not change the duration of the period, see the left graph: $T_0 \hspace{0.1cm}\underline{= 2\,\text{ms}}$. |
| − | [[File:P_ID262__Sig_A_2_1_a.png|center|frame| | + | [[File:P_ID262__Sig_A_2_1_a.png|center|frame|Periodic triangular signals]] |
| − | '''(4)''' | + | '''(4)''' After full-wave rectification, the signal $z(t)$ has double the frequency (see right graph). The following values apply here: |
:$$T_0 = 1\,\text{ms}, \hspace{0.5cm} f_0 = 1\,\text{kHz}, \hspace{0.5cm} \omega_0 \hspace{0.1cm}\underline{= 6283\,\text{1/s}}.$$ | :$$T_0 = 1\,\text{ms}, \hspace{0.5cm} f_0 = 1\,\text{kHz}, \hspace{0.5cm} \omega_0 \hspace{0.1cm}\underline{= 6283\,\text{1/s}}.$$ | ||
{{ML-Fuß}} | {{ML-Fuß}} | ||
__NOEDITSECTION__ | __NOEDITSECTION__ | ||
| − | [[Category: | + | [[Category:Signal Representation: Exercises|^2.1 Description of Periodic Signals^]] |
Latest revision as of 04:08, 18 September 2022
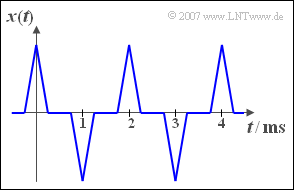
The graph shows the periodic signal $x(t)$. If $x(t)$ is applied to the input of a non-linearity with the characteristic curve
- $$y=g(x)=\left\{ {x \; \rm for\; \it x \geq \rm 0, \atop {\rm 0 \;\;\; \rm else,}}\right.$$
the signal $y(t)$ is obtained at the output. A second non-linear characteristic
- $$z=h(x)=|x|$$
delivers the signal $z(t)$.
Note:
- This exercise belongs to the chapter General description of periodic signals.
Questions
Solution
(1) Correct are the solutions 1 and 4:
- The non-linear characteristic $y = g(x)$ describes a half-wave rectifier.
- $z = h(x) = |x|$ describes a full-wave rectifier.
(2) The period duration $x(t)$ is $T_0 = 2\,\text{ms}$. The inverse magnitudes to the base frequency $f_0 \hspace{0.1cm}\underline{ = 500\,\text{Hz}}$.
(3) The half-wave rectification does not change the duration of the period, see the left graph: $T_0 \hspace{0.1cm}\underline{= 2\,\text{ms}}$.
(4) After full-wave rectification, the signal $z(t)$ has double the frequency (see right graph). The following values apply here:
- $$T_0 = 1\,\text{ms}, \hspace{0.5cm} f_0 = 1\,\text{kHz}, \hspace{0.5cm} \omega_0 \hspace{0.1cm}\underline{= 6283\,\text{1/s}}.$$

