Difference between revisions of "Signal Representation/Harmonic Oscillation"
| (83 intermediate revisions by 8 users not shown) | |||
| Line 1: | Line 1: | ||
{{Header | {{Header | ||
| − | |Untermenü= | + | |Untermenü=Periodic Signals |
| − | |Vorherige Seite= | + | |Vorherige Seite=Direct Current Signal - Limit Case of a Periodic Signal |
| − | |Nächste Seite= | + | |Nächste Seite=Fourier Series |
}} | }} | ||
| − | ==Definition | + | ==Definition and properties== |
| − | + | <br> | |
| + | [[File:Sig_T_2_3_S1_Version3.png|right|frame|Example of a harmonic oscillation]] | ||
| − | + | Harmonic oscillations are of particular importance for Communications Engineering as well as in many natural sciences. The diagram shows an exemplary signal waveform. | |
| − | + | Its importance is also related to the fact that the harmonic oscillation represents the solution of a differential equation which is found in many disciplines and reads as follows: | |
| − | $$ x(t) + k \cdot\ddot{x} (t) =0.$$ | + | :$$ x(t) + k \cdot\ddot{x} (t) = 0.$$ |
| − | + | Here the two dots mark the second derivative of the function $x(t)$ after time. | |
| + | <br clear=all> | ||
| − | {{Definition} | + | {{BlaueBox|TEXT= |
| − | + | $\text{Definition:}$ | |
| + | Any »'''harmonic oscillation'''« can be represented in most general form as follows: | ||
| − | $$x(t)= C \cdot \cos(2\pi f_0 t - \varphi).$$ | + | :$$x(t)= C \cdot \cos(2\pi f_0 t - \varphi).$$ |
| − | + | The following signal parameters are used: | |
| + | *the »'''amplitude'''« $C$ – simultaneously the maximum value of the signal, | ||
| + | *the »'''signal frequency'''« $f_{0}$ ⇒ the reciprocal of the period duration $T_{0}$, and | ||
| − | + | *the »'''zero phase angle'''« $($or briefly the »phase«$)$ $\varphi$ of the oscillation.}} | |
| − | * | ||
| − | |||
| − | |||
| − | + | ||
| − | + | The following $($German-language$)$ learning video illustrates the properties of harmonic oscillations using scales: <br> | |
| − | + | [[Harmonische_Schwingungen_(Lernvideo)|»Harmonische Schwingungen«]] ⇒ "Harmonic Oscillations". | |
| + | |||
| + | {{BlaueBox|TEXT= | ||
| + | $\text{Comments on nomenclature:}$ | ||
| + | |||
| + | In this tutorial – as usual in other literature when describing harmonic oscillations, Fourier series and Fourier integral – the phase is entered into the equations with negative sign, whereas in connection with all modulation methods the phase is entered with a plus sign. | ||
| + | *To distinguish between the two variants we use in our tutorial $\varphi$ and $\phi$. Both symbols denote the small Greek "phi". The spelling $\varphi$ is mainly used in the German and $\phi$ in the anglo–american language area. | ||
| + | |||
| + | *The indications $\varphi = 90^{\circ}$ and $\phi = -90^{\circ}$ are thus equivalent and both stand for the sine function: | ||
| − | $$\cos(2 \pi f_0 t - 90^{\circ}) = \cos(2 \pi f_0 t - \varphi) = \cos(2 \pi f_0 t + \phi) = \sin(2 \pi f_0 t ).$$ | + | :$$\cos(2 \pi f_0 t - 90^{\circ}) = \cos(2 \pi f_0 t - \varphi) = \cos(2 \pi f_0 t + \phi) = \sin(2 \pi f_0 t ).$$}} |
| − | |||
| − | |||
| + | ==Time domain representation== | ||
| + | <br> | ||
| + | The amplitude $C$ can be read directly from the adjacent graph. The signal frequency $f_0$ is the reciprocal of the period duration $T_0$. | ||
| + | [[File:P_ID129__Sig_T_2_3_S2a.png|right|frame|Signal parameters of a harmonic oscillation]] | ||
| − | + | If the above equation is written in the form | |
| − | + | :$$x(t) = C \cdot \cos(2\pi f_0 t - \varphi) = C \cdot \cos \big(2\pi f_0 (t - \tau) \big), $$ | |
| − | + | ||
| + | it becomes clear that the zero phase angle $\varphi$ and the shift $\tau$ relative to a cosine signal are related as follows | ||
| − | $$ | + | :$$\varphi = \frac{\tau}{T_0} \cdot 2{\pi}. $$ |
| + | |||
| + | *For a cosine signal both the parameters $\tau$ and $\varphi$ are zero. | ||
| − | + | *In contrast, a sinusoidal signal is shifted by $\tau = T_0/4$ and accordingly applies to the zero phase angle $\varphi = \pi/2$ $($in radians$)$ or $90^{\circ}$. | |
| + | |||
| + | *So it can be stated that – as assumed for the above sketch – at a positive value of $\tau$ resp. $\varphi$ the $($referring $t = 0)$ nearest signal maximum comes later than at the cosine signal and at negative values earlier. | ||
| − | $$ | + | *If a cosine signal is present at the system input and the output signal is delayed by a value $\tau$ then $\tau$ is also called the »runtime« of the system. |
| − | + | *Since a harmonic oscillation is clearly defined by three parameters, the entire time course from $-\infty$ to $+\infty$ can be calculated analytically from only three signal values $x_1=x(t_1)$, $x_2=x(t_2)$, $x_3=x(t_3)$ if the times $t_1$, $t_2$ and $t_3$ have been determined appropriately. | |
| − | |||
| − | |||
| − | {{ | + | {{GraueBox|TEXT= |
| + | [[File:P_ID2717__Sig_T_2_3_S2b_neu.png|right|frame|Harmonic oscillation, defined by only $3$ samples]] | ||
| + | $\text{Example 1:}$ | ||
| + | From the three sample values, | ||
| + | :$$x_1 = x(t_1 = 3.808 \;{\rm ms}) = +1.609,$$ | ||
| + | :$$x_2 = x(t_2 = 16.696 \;{\rm ms})=\hspace{0.05 cm} -0.469,$$ | ||
| + | :$$x_3 = x(t_3 = 33.84 \;{\rm ms}) = +1.227,$$ | ||
| − | + | you get the following system of equations: | |
| − | |||
| − | |||
| − | |||
| − | |||
| − | |||
| − | $C \cdot \cos(2\pi \hspace{0.05 cm} f_0 \hspace{0.05 cm} t_1 - \varphi) | + | :$$C \cdot \cos(2\pi \hspace{0.05 cm} f_0 \hspace{0.05 cm} t_1 - \varphi) = +1.609\hspace{0.05 cm},$$ |
| − | C \cdot \cos(2\pi \hspace{0.05 cm} f_0 \hspace{0.05 cm} t_2 - \varphi) | + | :$$C \cdot \cos(2\pi \hspace{0.05 cm} f_0 \hspace{0.05 cm} t_2 - \varphi) = \hspace{0.05 cm} -0.469\hspace{0.05 cm},$$ |
| − | C \cdot \cos(2\pi \hspace{0.05 cm} f_0 \hspace{0.05 cm} t_3 - \varphi) \hspace{ | + | :$$C \cdot \cos(2\pi \hspace{0.05 cm} f_0 \hspace{0.05 cm} t_3 - \varphi) = +1.227\hspace{0.05 cm}.$$ |
| + | |||
| + | After solving this nonlinear system of equations the following signal parameters are obtained: | ||
| + | *Signal amplitude: $C = 2$, | ||
| + | |||
| + | *period duration: $T_0 = 8 \;{\rm ms}$ ⇒ signal frequency $f_0 = 125 \;{\rm Hz}$, | ||
| + | |||
| + | *shift with respect to a cosine: $\tau = 3 \;{\rm ms}$ ⇒ zero phase angle $\varphi = 3\pi /4 = 135^\circ$. | ||
| − | |||
| − | |||
| − | |||
| − | |||
| − | |||
| − | |||
| + | If you set all sampling times $t_1$, $t_2$, $t_3$ in maxima, minima and/or zeros, there is no unique solution for the nonlinear equation system.}} | ||
| − | == | + | |
| − | + | ==Representation with cosine and sine components== | |
| + | <br> | ||
| + | Another representation of the harmonic oscillation is as follows: | ||
| − | $$x(t)=A\cdot\cos(2\pi f_0 t)+ B\cdot\sin(2\pi f_0 t).$$ | + | :$$x(t)=A\cdot\cos(2\pi f_0 t)+ B\cdot\sin(2\pi f_0 t).$$ |
| − | + | *The terms $A$ and $B$ for the amplitudes of the cosine and sine components are chosen to match the nomenclature of the following chapter [[Signal_Representation/Fourier_Series|»Fourier Series«]]. | |
| − | + | ||
| + | *By applying trigonometric transformations we obtain from the illustration in the last section: | ||
| − | $$x(t)=C\cdot \cos(2\pi f_0 t-\varphi)=C\cdot\cos(\varphi)\cdot\cos(2\pi f_0 t)+C\cdot\sin(\varphi)\cdot\sin(2\pi f_0 t).$$ | + | :$$x(t)=C\cdot \cos(2\pi f_0 t-\varphi)=C\cdot\cos(\varphi)\cdot\cos(2\pi f_0 t)+C\cdot\sin(\varphi)\cdot\sin(2\pi f_0 t).$$ |
| − | + | *From this follows directly by equating the coefficients: | |
| − | $$A=C\cdot\cos(\varphi),$$ | + | :$$A=C\cdot\cos(\varphi),$$ |
| + | :$$B=C\cdot\sin(\varphi).$$ | ||
| − | $$B | + | *The magnitude and the zero phase angle of the harmonic oscillation can be calculated from the parameters $A$ and $B$ also according to simple trigonometric considerations: |
| − | + | :$$C=\sqrt{A^2+B^2},$$ | |
| − | + | :$$\varphi = \arctan\left({-B}/{A}\right).$$ | |
| − | $$C=\sqrt{A^2+B^2}, | + | |
| + | {{BlaueBox|TEXT= | ||
| + | $\text{Please note:}$ | ||
| + | The minus–sign at the calculation of the zero phase angle $\varphi$ is related to the fact that $\varphi$ enters the argument of the cosine function with negative sign. If one would use the notation $\cos(2\pi f_0 t +\phi)$ instead of $\cos(2\pi f_0 t - \varphi)$, then $\phi= \arctan(B/A)$. Note the following here: | ||
| − | + | #For Fourier series and Fourier integral, the $\varphi$ representation is common in literature. | |
| + | #For description of the modulation methods, however, the $\phi$ representation is almost always used.}} | ||
| − | |||
| − | |||
| + | {{GraueBox|TEXT= | ||
| + | $\text{Example 2:}$ The oscillation shown in the left graphic as time course is characterized by the parameters[[File:Sig_T_2_3_S3_version2.png|right|frame|Harmonic oscillation. On the right: Represented in the complex plane]] | ||
| + | *$C=2,$ | ||
| + | *$f_0 = 125 \;{\rm Hz}$, | ||
| + | *$\varphi = +135^{\circ}$ ⇒ $\phi = -135^{\circ}$. | ||
| − | |||
| − | + | The oscillation is completely described by each of the two equations: | |
| + | |||
| + | :$$x(t) \hspace{-0.05cm}=\hspace{-0.05cm} 2\cdot \cos(2\pi f_0 t-135^{\circ})\hspace{0.05cm},$$ | ||
| + | :$$x(t) \hspace{-0.05cm}=\hspace{-0.05cm} -\sqrt{2}\cdot \cos(2\pi f_0 t) \hspace{-0.05cm}+\hspace{-0.05cm}\sqrt{2}\cdot \sin(2\pi f_0 t)\hspace{0.05cm}.$$ | ||
| + | The sketch on the right illustrates the trigonometrical calculation: | ||
| − | + | :$$A = 2\cdot \cos(-135^{\circ}) = -\sqrt{2}\hspace{0.05cm},$$ | |
| − | + | :$$B = 2\cdot \sin(-135^{\circ}) = +\sqrt{2}\hspace{0.05cm}.$$}} | |
| − | |||
| − | |||
| − | |||
| − | $$A | + | ==Spectral representation of a cosine signal== |
| − | + | <br> | |
| + | In order to derive the spectral function, we first restrict ourselves to a cosine signal, which also can be written with the complex exponential function and the [[Signal_Representation/Calculating_with_Complex_Numbers#Representation_by_magnitude_and_phase|»Euler theorem«]] in the following manner: | ||
| + | |||
| + | :$$x(t)=A \cdot \cos(2\pi f_0 t)={A}/{2}\cdot \big [{\rm e}^{\rm -j2 \pi \it f_{\rm 0} t} + {\rm e}^{\rm j2\pi \it f_{\rm 0} t} \big ].$$ | ||
| − | + | From this time domain representation it can be seen that the cosine signal contains – spectrally seen – only one single $($physical$)$ frequency, namely the frequency $f_0$. | |
| + | {{BlaueBox|TEXT= | ||
| + | $\text{Proof:}$ For the mathematical derivation of the spectral function we use the following relations: | ||
| + | *The equation from the section [[Signal_Representation/Direct_Current_Signal_-_Limit_Case_of_a_Periodic_Signal#Dirac_.28delta.29_function_in_frequency_domain|»Dirac delta function in frequency domain«]]: | ||
| + | :$$x(t)=A \ \circ\!\!-\!\!\!-\!\!\!-\!\!\bullet\, \ X(f)=A \cdot \rm \delta (\it f),$$ | ||
| − | + | *the [[Signal_Representation/Fourier_Transform_Theorems#Shifting_Theorem|»shifting theorem«]] $($for the frequency range$)$ in anticipation of a later chapter: | |
| + | :$$x(t) \cdot {\rm e}^{\rm j2\pi\it f_{\rm 0} t}\ \circ\!\!-\!\!\!-\!\!\!-\!\!\bullet\, \ X(f-f_0). $$ | ||
| − | + | This results in the following Fourier correspondence: | |
| − | $$x(t)=A \cdot \cos(2\pi | + | :$$x(t)=A\cdot \cos(2\pi f_0t)\ \circ\!\!-\!\!\!-\!\!\!-\!\!\bullet\, \ X(f)={A}/{\rm 2}\cdot {\rm \delta} (f+f_{\rm 0})+{A}/{\rm 2}\cdot {\rm \delta}(\ f-f_{\rm 0}).$$ |
| − | + | This means: | |
| − | + | *The spectral function $X(f)$ of a cosine signal with frequency $f_0$ is composed of two Dirac delta functions at $\pm f_0$. | |
| − | * | ||
| − | |||
| − | * | + | * The impulse weights are each equal to half the signal amplitude.}} |
| − | |||
| − | + | ||
| + | {{GraueBox|TEXT= | ||
| + | [[File:P_ID1365__Sig_T_2_3_S4_neu.png|right|frame|Spectrum of a cosine signal]] | ||
| + | $\text{Example 3:}$ | ||
| + | The diagram shows the spectrum of a cosine oscillation with | ||
| + | *amplitude $A = 4 \;{\rm V}$ and | ||
| − | $ | + | *frequency $f_0 = 5 \;{\rm kHz}$ ⇒ $T_0 = 200 \;{\rm µ s}$. |
| − | |||
| + | Then the following relation to the above equation applies: | ||
| + | #The Dirac delta function at $-f_0$ belongs to the first term <br>$($derivable from the condition $f + f_0 = 0)$. | ||
| + | #The Dirac delta function for $+f_0$ belongs to the second term <br>$($derivable from the condition $f - f_0 = 0)$. | ||
| + | #Both impulse weights are $A/2 = 2 \;{\rm V}$.}} | ||
| − | {{ | + | |
| − | [[ | + | {{BlaueBox|TEXT= |
| − | + | $\text{Note:}$ | |
| − | + | The spectral function of any real time function except the DC signal has components at both positive and negative frequencies. | |
| + | *This fact, which often causes problems for first-year students, is formally derived from the [[Signal_Representation/Calculating_with_Complex_Numbers#Representation_by_magnitude_and_phase|»Euler theorem«]]. | ||
| + | |||
| + | *By extending the frequency range from $f \ge 0$ to the set of real numbers you get from the physical to the »mathematical frequency«. | ||
| + | |||
| + | *However, for a negative frequency the [[Signal_Representation/Harmonic_Oscillation#Definition_and_properties|$\text{definition}$]] is not applicable anymore: You cannot interpret $\rm -5\ kHz$ as "minus 5000 oscillations per second". | ||
| − | + | In the process of this course you will find that '''by complicating a simple subject, more complex matters can later be described very elegantly and simply'''.}} | |
| − | |||
| − | == | + | ==General spectral representation== |
| + | <br> | ||
| + | For a sinusoidal signal the »[https://en.wikipedia.org/wiki/Leonhard_Euler $\text{Euler}$] '''theorem'''« applies in a similar way: | ||
| − | + | :$$x(t)=B\cdot \sin(2 \pi f_0 t)= \frac{\it B}{2 \rm j} \cdot \big [{\rm e}^{+{\rm j} 2 \pi \it f_{\rm 0} t}-{\rm e}^{-\rm j2 \pi \it f_{\rm 0} t}\big ]=\rm j\cdot {\it B}/{2} \cdot \big [{\rm e}^{-j2 \pi \it f_{\rm 0} t}-{\rm e}^{+\rm j2 \pi \it f_{\rm 0} t} \big ] .$$ | |
| − | $$x(t)=B\cdot \sin(2 \pi f_0 t) | + | From this follows for the spectral function, which is now purely imaginary: |
| + | :$$x(t)=B\cdot \sin(2\pi f_0 t)\;\ \circ\!\!-\!\!\!-\!\!\!-\!\!\bullet\; \ X(f)={\rm j} \cdot \big [ {B}/{2} \cdot \delta (f+f_0)- {B}/{2} \cdot \delta (f-f_0) \big ].$$ | ||
| − | |||
| − | $$x(t)= | + | {{GraueBox|TEXT= |
| + | [[File: P_ID2719__Sig_T_2_3_S5.png |right|frame|Spectrum of a sinusoidal signal]] | ||
| + | $\text{Example 4:}$ | ||
| + | The figure shows the imaginary spectrum of a sine wave $x(t)$ with | ||
| + | *amplitude $B = 3 \;{\rm V},$ | ||
| + | *frequency $f_0 = 5\;{\rm kHz},$ | ||
| + | |||
| + | *zero phase angle $\varphi=90^{\circ}$ ⇒ $\phi = -90^{\circ}$. | ||
| + | <br>$\text{Please note}$: | ||
| − | + | #For the positive frequency $(f = +f_0)$ the imaginary part is negative.<br> | |
| − | + | #The negative frequency $(f = -f_0)$ results in a positive imaginary part.}} | |
| − | |||
| − | |||
| − | |||
| − | + | When the cosine and sine components are superimposed according to the relationship | |
| − | $$x(t)=A \cdot \cos(2\pi f_0 t) +B \cdot \sin(2 \pi f_0 t)$$ | + | :$$x(t)=A \cdot \cos(2\pi f_0 t) +B \cdot \sin(2 \pi f_0 t)$$ |
| − | + | the individual spectral functions also overlap and you get | |
| − | $$X(f)=\frac{A+{\rm j} \cdot B}{2}\ | + | :$$X(f)=\frac{A+{\rm j} \cdot B}{2}\cdot {\rm \delta} (f+f_0)+\frac{A-{\rm j} \cdot B}{2} \cdot \delta (f-f_0).$$ |
| − | + | This Fourier correlation is with amplitude $C$ and phase $\varphi$: | |
| − | $$x(t)=C\cdot \cos(2\pi f_0 t-\varphi) \circ\!\!-\!\!\!-\!\!\!-\!\!\bullet\, X(f)= | + | :$$x(t)=C\cdot \cos(2\pi f_0 t-\varphi)\ \, \circ\!\!-\!\!\!-\!\!\!-\!\!\bullet\,\ X(f)={C}/{2}\cdot {\rm e}^{{\rm j} \varphi} \cdot \delta(f+f_0) + {C}/{2} \cdot {\rm e}^{\rm{-j} \varphi} \cdot \delta (f-f_0).$$ |
| + | |||
| + | {{BlaueBox|TEXT= | ||
| + | $\text{One recognizes:}$ The spectral function $X(f)$ | ||
| + | *is not only defined for positive and negative frequencies, | ||
| + | |||
| + | *but it is also complex-valued.}} | ||
| + | |||
| + | |||
| + | {{GraueBox|TEXT= | ||
| + | [[File:Sig_T_2_3_S6_version2.png|right|frame|Spectrum of the $\varphi=30^{\circ}$ oscillation]] | ||
| + | $\text{Example 5:}$ | ||
| + | With the parameters $C = 5 \;{\rm V}$, $f_0 = 5\;{\rm kHz}$ and $\varphi=30^{\circ}$ $($in radian measure $\pi/6)$ results | ||
| + | the real and/or imaginary part of $X(f)$ according to the graph: | ||
| + | |||
| + | :$${\rm Re}\big[X(f)\big]=2.165\,{\rm V} \cdot \delta(f+f_0) + 2.165\,{\rm V} \cdot \delta (f-f_0).$$ | ||
| + | |||
| + | :$${\rm Im}\big[X(f)\big]=1.25\,{\rm V} \cdot \delta(f+f_0) -1.25\,{\rm V} \cdot \delta (f-f_0).$$ | ||
| − | + | Because of: | |
| − | |||
| − | + | :$$2.5 · \cos(30^{\circ}) = 2.165,$$ | |
| + | :$$2.5 · \sin(30^{\circ}) = 1.25.$$}} | ||
| − | |||
| − | |||
| − | + | The following (German-language) learning video illustrates the properties of harmonic oscillations using scales: <br> | |
| + | [[Harmonische_Schwingungen_(Lernvideo)|»Harmonische Schwingungen»]] ⇒ "Harmonic Oscillations". | ||
| − | |||
| + | ==Exercises for the chapter== | ||
| + | <br> | ||
| + | [[Aufgaben:Exercises_2.3:_Cosine_and_Sine_Components|Exercise 2.3: Cosine and Sine Components]] | ||
| + | [[Aufgaben:Exercise_2.3Z:_Oscillation_Parameters|Exercise 2.3Z: Oscillation Parameters]] | ||
{{Display}} | {{Display}} | ||
Latest revision as of 16:39, 9 June 2023
Contents
Definition and properties
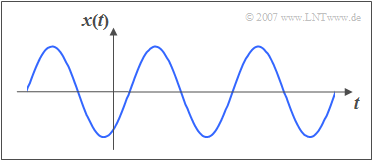
Harmonic oscillations are of particular importance for Communications Engineering as well as in many natural sciences. The diagram shows an exemplary signal waveform.
Its importance is also related to the fact that the harmonic oscillation represents the solution of a differential equation which is found in many disciplines and reads as follows:
- $$ x(t) + k \cdot\ddot{x} (t) = 0.$$
Here the two dots mark the second derivative of the function $x(t)$ after time.
$\text{Definition:}$ Any »harmonic oscillation« can be represented in most general form as follows:
- $$x(t)= C \cdot \cos(2\pi f_0 t - \varphi).$$
The following signal parameters are used:
- the »amplitude« $C$ – simultaneously the maximum value of the signal,
- the »signal frequency« $f_{0}$ ⇒ the reciprocal of the period duration $T_{0}$, and
- the »zero phase angle« $($or briefly the »phase«$)$ $\varphi$ of the oscillation.
The following $($German-language$)$ learning video illustrates the properties of harmonic oscillations using scales:
»Harmonische Schwingungen« ⇒ "Harmonic Oscillations".
$\text{Comments on nomenclature:}$
In this tutorial – as usual in other literature when describing harmonic oscillations, Fourier series and Fourier integral – the phase is entered into the equations with negative sign, whereas in connection with all modulation methods the phase is entered with a plus sign.
- To distinguish between the two variants we use in our tutorial $\varphi$ and $\phi$. Both symbols denote the small Greek "phi". The spelling $\varphi$ is mainly used in the German and $\phi$ in the anglo–american language area.
- The indications $\varphi = 90^{\circ}$ and $\phi = -90^{\circ}$ are thus equivalent and both stand for the sine function:
- $$\cos(2 \pi f_0 t - 90^{\circ}) = \cos(2 \pi f_0 t - \varphi) = \cos(2 \pi f_0 t + \phi) = \sin(2 \pi f_0 t ).$$
Time domain representation
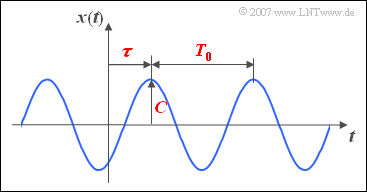
The amplitude $C$ can be read directly from the adjacent graph. The signal frequency $f_0$ is the reciprocal of the period duration $T_0$.
If the above equation is written in the form
- $$x(t) = C \cdot \cos(2\pi f_0 t - \varphi) = C \cdot \cos \big(2\pi f_0 (t - \tau) \big), $$
it becomes clear that the zero phase angle $\varphi$ and the shift $\tau$ relative to a cosine signal are related as follows
- $$\varphi = \frac{\tau}{T_0} \cdot 2{\pi}. $$
- For a cosine signal both the parameters $\tau$ and $\varphi$ are zero.
- In contrast, a sinusoidal signal is shifted by $\tau = T_0/4$ and accordingly applies to the zero phase angle $\varphi = \pi/2$ $($in radians$)$ or $90^{\circ}$.
- So it can be stated that – as assumed for the above sketch – at a positive value of $\tau$ resp. $\varphi$ the $($referring $t = 0)$ nearest signal maximum comes later than at the cosine signal and at negative values earlier.
- If a cosine signal is present at the system input and the output signal is delayed by a value $\tau$ then $\tau$ is also called the »runtime« of the system.
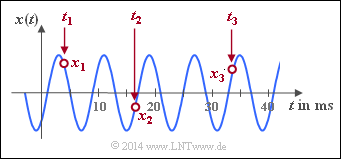
- Since a harmonic oscillation is clearly defined by three parameters, the entire time course from $-\infty$ to $+\infty$ can be calculated analytically from only three signal values $x_1=x(t_1)$, $x_2=x(t_2)$, $x_3=x(t_3)$ if the times $t_1$, $t_2$ and $t_3$ have been determined appropriately.
$\text{Example 1:}$ From the three sample values,
- $$x_1 = x(t_1 = 3.808 \;{\rm ms}) = +1.609,$$
- $$x_2 = x(t_2 = 16.696 \;{\rm ms})=\hspace{0.05 cm} -0.469,$$
- $$x_3 = x(t_3 = 33.84 \;{\rm ms}) = +1.227,$$
you get the following system of equations:
- $$C \cdot \cos(2\pi \hspace{0.05 cm} f_0 \hspace{0.05 cm} t_1 - \varphi) = +1.609\hspace{0.05 cm},$$
- $$C \cdot \cos(2\pi \hspace{0.05 cm} f_0 \hspace{0.05 cm} t_2 - \varphi) = \hspace{0.05 cm} -0.469\hspace{0.05 cm},$$
- $$C \cdot \cos(2\pi \hspace{0.05 cm} f_0 \hspace{0.05 cm} t_3 - \varphi) = +1.227\hspace{0.05 cm}.$$
After solving this nonlinear system of equations the following signal parameters are obtained:
- Signal amplitude: $C = 2$,
- period duration: $T_0 = 8 \;{\rm ms}$ ⇒ signal frequency $f_0 = 125 \;{\rm Hz}$,
- shift with respect to a cosine: $\tau = 3 \;{\rm ms}$ ⇒ zero phase angle $\varphi = 3\pi /4 = 135^\circ$.
If you set all sampling times $t_1$, $t_2$, $t_3$ in maxima, minima and/or zeros, there is no unique solution for the nonlinear equation system.
Representation with cosine and sine components
Another representation of the harmonic oscillation is as follows:
- $$x(t)=A\cdot\cos(2\pi f_0 t)+ B\cdot\sin(2\pi f_0 t).$$
- The terms $A$ and $B$ for the amplitudes of the cosine and sine components are chosen to match the nomenclature of the following chapter »Fourier Series«.
- By applying trigonometric transformations we obtain from the illustration in the last section:
- $$x(t)=C\cdot \cos(2\pi f_0 t-\varphi)=C\cdot\cos(\varphi)\cdot\cos(2\pi f_0 t)+C\cdot\sin(\varphi)\cdot\sin(2\pi f_0 t).$$
- From this follows directly by equating the coefficients:
- $$A=C\cdot\cos(\varphi),$$
- $$B=C\cdot\sin(\varphi).$$
- The magnitude and the zero phase angle of the harmonic oscillation can be calculated from the parameters $A$ and $B$ also according to simple trigonometric considerations:
- $$C=\sqrt{A^2+B^2},$$
- $$\varphi = \arctan\left({-B}/{A}\right).$$
$\text{Please note:}$ The minus–sign at the calculation of the zero phase angle $\varphi$ is related to the fact that $\varphi$ enters the argument of the cosine function with negative sign. If one would use the notation $\cos(2\pi f_0 t +\phi)$ instead of $\cos(2\pi f_0 t - \varphi)$, then $\phi= \arctan(B/A)$. Note the following here:
- For Fourier series and Fourier integral, the $\varphi$ representation is common in literature.
- For description of the modulation methods, however, the $\phi$ representation is almost always used.
- $C=2,$
- $f_0 = 125 \;{\rm Hz}$,
- $\varphi = +135^{\circ}$ ⇒ $\phi = -135^{\circ}$.
The oscillation is completely described by each of the two equations:
- $$x(t) \hspace{-0.05cm}=\hspace{-0.05cm} 2\cdot \cos(2\pi f_0 t-135^{\circ})\hspace{0.05cm},$$
- $$x(t) \hspace{-0.05cm}=\hspace{-0.05cm} -\sqrt{2}\cdot \cos(2\pi f_0 t) \hspace{-0.05cm}+\hspace{-0.05cm}\sqrt{2}\cdot \sin(2\pi f_0 t)\hspace{0.05cm}.$$
The sketch on the right illustrates the trigonometrical calculation:
- $$A = 2\cdot \cos(-135^{\circ}) = -\sqrt{2}\hspace{0.05cm},$$
- $$B = 2\cdot \sin(-135^{\circ}) = +\sqrt{2}\hspace{0.05cm}.$$
Spectral representation of a cosine signal
In order to derive the spectral function, we first restrict ourselves to a cosine signal, which also can be written with the complex exponential function and the »Euler theorem« in the following manner:
- $$x(t)=A \cdot \cos(2\pi f_0 t)={A}/{2}\cdot \big [{\rm e}^{\rm -j2 \pi \it f_{\rm 0} t} + {\rm e}^{\rm j2\pi \it f_{\rm 0} t} \big ].$$
From this time domain representation it can be seen that the cosine signal contains – spectrally seen – only one single $($physical$)$ frequency, namely the frequency $f_0$.
$\text{Proof:}$ For the mathematical derivation of the spectral function we use the following relations:
- The equation from the section »Dirac delta function in frequency domain«:
- $$x(t)=A \ \circ\!\!-\!\!\!-\!\!\!-\!\!\bullet\, \ X(f)=A \cdot \rm \delta (\it f),$$
- the »shifting theorem« $($for the frequency range$)$ in anticipation of a later chapter:
- $$x(t) \cdot {\rm e}^{\rm j2\pi\it f_{\rm 0} t}\ \circ\!\!-\!\!\!-\!\!\!-\!\!\bullet\, \ X(f-f_0). $$
This results in the following Fourier correspondence:
- $$x(t)=A\cdot \cos(2\pi f_0t)\ \circ\!\!-\!\!\!-\!\!\!-\!\!\bullet\, \ X(f)={A}/{\rm 2}\cdot {\rm \delta} (f+f_{\rm 0})+{A}/{\rm 2}\cdot {\rm \delta}(\ f-f_{\rm 0}).$$
This means:
- The spectral function $X(f)$ of a cosine signal with frequency $f_0$ is composed of two Dirac delta functions at $\pm f_0$.
- The impulse weights are each equal to half the signal amplitude.
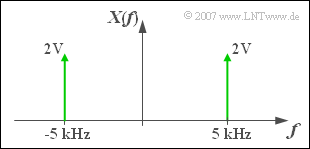
$\text{Example 3:}$ The diagram shows the spectrum of a cosine oscillation with
- amplitude $A = 4 \;{\rm V}$ and
- frequency $f_0 = 5 \;{\rm kHz}$ ⇒ $T_0 = 200 \;{\rm µ s}$.
Then the following relation to the above equation applies:
- The Dirac delta function at $-f_0$ belongs to the first term
$($derivable from the condition $f + f_0 = 0)$. - The Dirac delta function for $+f_0$ belongs to the second term
$($derivable from the condition $f - f_0 = 0)$. - Both impulse weights are $A/2 = 2 \;{\rm V}$.
$\text{Note:}$ The spectral function of any real time function except the DC signal has components at both positive and negative frequencies.
- This fact, which often causes problems for first-year students, is formally derived from the »Euler theorem«.
- By extending the frequency range from $f \ge 0$ to the set of real numbers you get from the physical to the »mathematical frequency«.
- However, for a negative frequency the $\text{definition}$ is not applicable anymore: You cannot interpret $\rm -5\ kHz$ as "minus 5000 oscillations per second".
In the process of this course you will find that by complicating a simple subject, more complex matters can later be described very elegantly and simply.
General spectral representation
For a sinusoidal signal the »$\text{Euler}$ theorem« applies in a similar way:
- $$x(t)=B\cdot \sin(2 \pi f_0 t)= \frac{\it B}{2 \rm j} \cdot \big [{\rm e}^{+{\rm j} 2 \pi \it f_{\rm 0} t}-{\rm e}^{-\rm j2 \pi \it f_{\rm 0} t}\big ]=\rm j\cdot {\it B}/{2} \cdot \big [{\rm e}^{-j2 \pi \it f_{\rm 0} t}-{\rm e}^{+\rm j2 \pi \it f_{\rm 0} t} \big ] .$$
From this follows for the spectral function, which is now purely imaginary:
- $$x(t)=B\cdot \sin(2\pi f_0 t)\;\ \circ\!\!-\!\!\!-\!\!\!-\!\!\bullet\; \ X(f)={\rm j} \cdot \big [ {B}/{2} \cdot \delta (f+f_0)- {B}/{2} \cdot \delta (f-f_0) \big ].$$
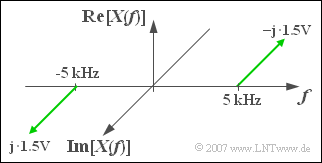
$\text{Example 4:}$ The figure shows the imaginary spectrum of a sine wave $x(t)$ with
- amplitude $B = 3 \;{\rm V},$
- frequency $f_0 = 5\;{\rm kHz},$
- zero phase angle $\varphi=90^{\circ}$ ⇒ $\phi = -90^{\circ}$.
$\text{Please note}$:
- For the positive frequency $(f = +f_0)$ the imaginary part is negative.
- The negative frequency $(f = -f_0)$ results in a positive imaginary part.
When the cosine and sine components are superimposed according to the relationship
- $$x(t)=A \cdot \cos(2\pi f_0 t) +B \cdot \sin(2 \pi f_0 t)$$
the individual spectral functions also overlap and you get
- $$X(f)=\frac{A+{\rm j} \cdot B}{2}\cdot {\rm \delta} (f+f_0)+\frac{A-{\rm j} \cdot B}{2} \cdot \delta (f-f_0).$$
This Fourier correlation is with amplitude $C$ and phase $\varphi$:
- $$x(t)=C\cdot \cos(2\pi f_0 t-\varphi)\ \, \circ\!\!-\!\!\!-\!\!\!-\!\!\bullet\,\ X(f)={C}/{2}\cdot {\rm e}^{{\rm j} \varphi} \cdot \delta(f+f_0) + {C}/{2} \cdot {\rm e}^{\rm{-j} \varphi} \cdot \delta (f-f_0).$$
$\text{One recognizes:}$ The spectral function $X(f)$
- is not only defined for positive and negative frequencies,
- but it is also complex-valued.
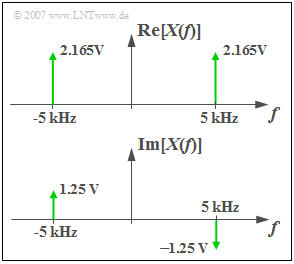
$\text{Example 5:}$ With the parameters $C = 5 \;{\rm V}$, $f_0 = 5\;{\rm kHz}$ and $\varphi=30^{\circ}$ $($in radian measure $\pi/6)$ results the real and/or imaginary part of $X(f)$ according to the graph:
- $${\rm Re}\big[X(f)\big]=2.165\,{\rm V} \cdot \delta(f+f_0) + 2.165\,{\rm V} \cdot \delta (f-f_0).$$
- $${\rm Im}\big[X(f)\big]=1.25\,{\rm V} \cdot \delta(f+f_0) -1.25\,{\rm V} \cdot \delta (f-f_0).$$
Because of:
- $$2.5 · \cos(30^{\circ}) = 2.165,$$
- $$2.5 · \sin(30^{\circ}) = 1.25.$$
The following (German-language) learning video illustrates the properties of harmonic oscillations using scales:
»Harmonische Schwingungen» ⇒ "Harmonic Oscillations".
Exercises for the chapter
Exercise 2.3: Cosine and Sine Components
Exercise 2.3Z: Oscillation Parameters
