Difference between revisions of "Aufgaben:Exercise 4.2: Low-Pass for Signal Reconstruction"
| (One intermediate revision by one other user not shown) | |||
| Line 3: | Line 3: | ||
}} | }} | ||
| − | [[File: | + | [[File:EN_Mod_A_4_2.png|right|frame|Examples of continuous and discrete spectra]] |
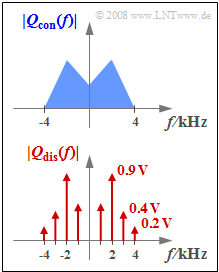
We consider in this exercise two different source signals $q_{\rm con}(t)$ and $q_{\rm dis}(t)$ whose magnitude spectra $|Q_{\rm con}(f)|$ and $|Q_{\rm dis}(f)|$ are plotted. The highest frequency occurring in the signals is in each case $4 \rm kHz$. | We consider in this exercise two different source signals $q_{\rm con}(t)$ and $q_{\rm dis}(t)$ whose magnitude spectra $|Q_{\rm con}(f)|$ and $|Q_{\rm dis}(f)|$ are plotted. The highest frequency occurring in the signals is in each case $4 \rm kHz$. | ||
* Nothing more is known of the spectral function $Q_{\rm con}(f)$ than that it is a continuous spectrum, where: | * Nothing more is known of the spectral function $Q_{\rm con}(f)$ than that it is a continuous spectrum, where: | ||
| Line 65: | Line 65: | ||
{{ML-Kopf}} | {{ML-Kopf}} | ||
'''(1)''' Only the <u>first statement</u> is correct: | '''(1)''' Only the <u>first statement</u> is correct: | ||
| − | *Sampling $q_{\rm dis}(t)$ with sampling frequency $f_{\rm A} = 8 \ \rm kHz$ leads to an irreversible error, since $Q_{\rm dis}(f)$ involves a discrete spectral component (Dirac line) at $f_4 = 4\ \rm kHz$ and the phase value is $φ_4 ≠ 0$. | + | *Sampling $q_{\rm dis}(t)$ with sampling frequency $f_{\rm A} = 8 \ \rm kHz$ leads to an irreversible error, since $Q_{\rm dis}(f)$ involves a discrete spectral component (Dirac delta line) at $f_4 = 4\ \rm kHz$ and the phase value is $φ_4 ≠ 0$. |
*With the phase value $φ_4 = 90^\circ$ $(4 \ \rm kHz$ sinusoidal component$)$ given here holds $ε_{\rm dis}(t) = v_{\rm dis}(t) - q_{\rm dis}(t) = -0. 4 \ \rm V - \sin(2π \cdot f_4 \cdot t)$. See also solution to Exercise 4.2Z. | *With the phase value $φ_4 = 90^\circ$ $(4 \ \rm kHz$ sinusoidal component$)$ given here holds $ε_{\rm dis}(t) = v_{\rm dis}(t) - q_{\rm dis}(t) = -0. 4 \ \rm V - \sin(2π \cdot f_4 \cdot t)$. See also solution to Exercise 4.2Z. | ||
*On the other hand, the signal $q_{\rm con}(t)$ with the continuous spectrum $Q_{\rm con}(f)$ can also then be measured with a rectangular low-pass filter $($with cutoff frequency $f_{\rm G} = 4\ \rm kHz)$ be completely reconstructed if sampling frequency $f_{\rm A} = 8\ \rm kHz$ was used. For all frequencies not equal to $f_4$ the sampling theorem is satisfied. | *On the other hand, the signal $q_{\rm con}(t)$ with the continuous spectrum $Q_{\rm con}(f)$ can also then be measured with a rectangular low-pass filter $($with cutoff frequency $f_{\rm G} = 4\ \rm kHz)$ be completely reconstructed if sampling frequency $f_{\rm A} = 8\ \rm kHz$ was used. For all frequencies not equal to $f_4$ the sampling theorem is satisfied. | ||
| − | *The contribution of the $f_4$ component to the total spectrum $Q_{\rm con}(f)$ is only vanishingly small ⇒ ${\rm Pr}(f_4) → 0$ as long as the spectrum has no Dirac line at $f_4$. | + | *The contribution of the $f_4$ component to the total spectrum $Q_{\rm con}(f)$ is only vanishingly small ⇒ ${\rm Pr}(f_4) → 0$ as long as the spectrum has no Dirac delta line at $f_4$. |
| Line 85: | Line 85: | ||
| − | [[File: | + | [[File:EN_Mod_A_4_2d_neu.png|P_ID1609__Mod_A_4_2d.png|right|frame|Signal reconstruction with too large cutoff frequency]] |
'''(4)''' The correct solution here is <u>suggested solution 3</u>: | '''(4)''' The correct solution here is <u>suggested solution 3</u>: | ||
*Sampling with $f_{\rm A} = 10\ \rm kHz$ yields the periodic spectrum sketched on the right. | *Sampling with $f_{\rm A} = 10\ \rm kHz$ yields the periodic spectrum sketched on the right. | ||
Latest revision as of 15:31, 18 January 2023
We consider in this exercise two different source signals $q_{\rm con}(t)$ and $q_{\rm dis}(t)$ whose magnitude spectra $|Q_{\rm con}(f)|$ and $|Q_{\rm dis}(f)|$ are plotted. The highest frequency occurring in the signals is in each case $4 \rm kHz$.
- Nothing more is known of the spectral function $Q_{\rm con}(f)$ than that it is a continuous spectrum, where:
- $$Q_{\rm con}(|f| \le 4\,{\rm kHz}) \ne 0 \hspace{0.05cm}.$$
- The spectrum $Q_{\rm dis}(f)$ contains spectral lines at $±1 \ \rm kHz$, $±2 \ \rm kHz$, $±3 \ \rm kHz$ and $±4 \ \rm kHz$. Thus:
- $$q_{\rm dis}(t) = \sum_{i=1}^{4}C_i \cdot \cos (2 \pi \cdot f_i \cdot t - \varphi_i),$$
- Amplitude values: $C_1 = 1.0 \ \rm V$, $C_2 = 1.8 \ \rm V$, $C_3 = 0.8 \ \rm V$, $C_4 = 0.4 \ \rm V.$
- The phase values $φ_1$, $φ_2$ and $φ_3$ are respectively in the range $±180^\circ$ and it holds $φ_4 = 90^\circ$.
The signals are each sampled at frequency $f_{\rm A}$ and immediately fed to an ideal rectangular low-pass filter with cutoff frequency $f_{\rm G}$ This scenario applies, for example, to
- the interference-free pulse amplitude modulation $\rm (PAM)$ and
- the interference-free pulse code modulation $\rm (PCM)$ at infinitely large quantization stage number $M$.
The output signal of the (rectangular) low-pass filter is called the sink signal $v(t)$ and for the error signal:
- $$ε(t) = v(t) - q(t).$$
This is different from zero only if the parameters of the sampling $($sampling frequency $f_{\rm A})$ and/or the signal reconstruction $($cutoff frequency $f_{\rm G})$ are not dimensioned in the best possible way.
Hints:
- The exercise belongs to the chapter "Pulse Code Modulation".
- Reference is made in particular to the page "Sampling and Signal Reconstruction".
Questions
Solution
- Sampling $q_{\rm dis}(t)$ with sampling frequency $f_{\rm A} = 8 \ \rm kHz$ leads to an irreversible error, since $Q_{\rm dis}(f)$ involves a discrete spectral component (Dirac delta line) at $f_4 = 4\ \rm kHz$ and the phase value is $φ_4 ≠ 0$.
- With the phase value $φ_4 = 90^\circ$ $(4 \ \rm kHz$ sinusoidal component$)$ given here holds $ε_{\rm dis}(t) = v_{\rm dis}(t) - q_{\rm dis}(t) = -0. 4 \ \rm V - \sin(2π \cdot f_4 \cdot t)$. See also solution to Exercise 4.2Z.
- On the other hand, the signal $q_{\rm con}(t)$ with the continuous spectrum $Q_{\rm con}(f)$ can also then be measured with a rectangular low-pass filter $($with cutoff frequency $f_{\rm G} = 4\ \rm kHz)$ be completely reconstructed if sampling frequency $f_{\rm A} = 8\ \rm kHz$ was used. For all frequencies not equal to $f_4$ the sampling theorem is satisfied.
- The contribution of the $f_4$ component to the total spectrum $Q_{\rm con}(f)$ is only vanishingly small ⇒ ${\rm Pr}(f_4) → 0$ as long as the spectrum has no Dirac delta line at $f_4$.
(2) Only the proposed solution 1 is correct:
- With $f_{\rm A} = 10\ \rm kHz$ the sampling theorem is satisfied in both cases.
- With $f_{\rm G} = f_{\rm A} /2$ both error signals $ε_{\rm con}(t)$ and $ε_{\rm dis}(t)$ are identically zero.
- In addition, the signal reconstruction also works as long as $f_{\rm G} > 4 \ \rm kHz$ and $f_{\rm G} < 6 \ \rm kHz$ holds.
(3) The correct solution here is suggested solution 2:
- With $f_{\rm G} = 3.5 \ \rm kHz$ the low-pass incorrectly removes the $4\ \rm kHz$ component, that is, then holds:
- $$ v_{\rm dis}(t) = q_{\rm dis}(t) - 0.4\,{\rm V} \cdot \sin (2 \pi \cdot f_{\rm 4} \cdot t)\hspace{0.3cm}\Rightarrow \hspace{0.3cm} \varepsilon_{\rm dis}(t) = - 0.4\,{\rm V} \cdot \sin (2 \pi \cdot f_{\rm 4} \cdot t)\hspace{0.05cm}.$$
(4) The correct solution here is suggested solution 3:
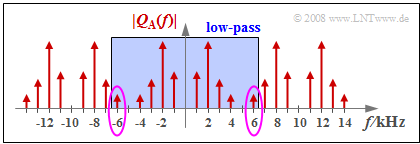
- Sampling with $f_{\rm A} = 10\ \rm kHz$ yields the periodic spectrum sketched on the right.
- The low-pass with $f_{\rm G} = 6.5 \ \rm kHz$ removes all discrete frequency components with $|f| ≥ 7\ \rm kHz$, but not the $6\ \rm kHz$ component.
The error signal $ε_{\rm dis}(t) = v_{\rm dis}(t) - q_{\rm dis}(t)$ is then a harmonic oscillation with
- the frequency $f_6 = f_{\rm A} - f_4 = 6\ \rm kHz$,
- the amplitude $A_4$ of the $f_4$ component,
- the phase $φ_{-4} = -φ_4$ of the $Q(f)$ component at $f = -f_4$.

