Difference between revisions of "Aufgaben:Exercise 4.6: Locality Curve for SSB-AM"
| Line 3: | Line 3: | ||
}} | }} | ||
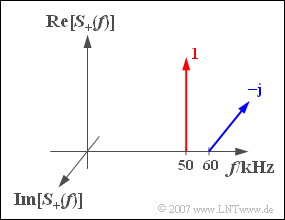
| − | [[File:P_ID764__Sig_A_4_6.png|250px|right|frame| | + | [[File:P_ID764__Sig_A_4_6.png|250px|right|frame|spectrum of the analytical signal]] |
We consider the analytical signal $s_+(t)$ with the spectral function | We consider the analytical signal $s_+(t)$ with the spectral function | ||
| Line 12: | Line 12: | ||
Here $f_{50}$ and $f_{60}$ are abbreviations for the frequencies $50 \ \rm kHz$ and $60 \ \rm kHz$ respectively. | Here $f_{50}$ and $f_{60}$ are abbreviations for the frequencies $50 \ \rm kHz$ and $60 \ \rm kHz$ respectively. | ||
| − | In this task, the course of the equivalent low-pass signal $s_{\rm TP}(t)$ | + | In this task, the course of the equivalent low-pass signal $s_{\rm TP}(t)$ , which is also referred to as the „locus curve” in this tutorial. |
| − | *In | + | *In subtasks '''(1)''' to '''(3)''' , we assume that the signal $s(t)$ is produced by a single sideband amplitude modulation of the sinusoidal message signal of frequency $f_{\rm N} = 10 \ \text{ kHz}$ with a cosinusoidal carrier at $f_{\rm T} = f_{50}$ , whereby only the upper sideband is transmitted („USB modulation”). |
| − | * | + | *In contrast, subtask '''(4)''' assumes the carrier frequency $f_{\rm T} = f_{60}$ . This assumption presupposes that LSB modulation has taken place. |
| Line 23: | Line 23: | ||
| − | '' | + | ''Hints:'' |
| − | * | + | *This task belongs to the chapter [[Signal_Representation/Equivalent_Low_Pass_Signal_and_Its_Spectral_Function|Equivalent Low Pass Signal and Its Spectral Function]]. |
| − | * | + | *You can check your solution with the interactive applet [[Applets:Physikalisches_Signal_%26_Äquivalentes_TP-Signal|Physical signal & equivalent LP signal]] ⇒ locus curve. |
| − | === | + | ===Questions=== |
<quiz display=simple> | <quiz display=simple> | ||
| − | { | + | {Give the equivalent low-pass signal $s_{\rm TP}(t)$ for the carrier frequency $f_{\rm N} = 10 \ \text{ kHz}$ . Which of the following statements are true? |
|type="()"} | |type="()"} | ||
| − | - | + | - The locus curve describes an ellipse. |
| − | + | + | + The locus curve describes a circle. |
| − | - | + | - The locus curve describes an arc. |
| − | { | + | {Calculate the magnitude function $a(t) = |s_{\rm TP}(t)|$. What is the value of $a_0$ at $t = 0$ and the minimum and maximum values of the magnitude? |
|type="{}"} | |type="{}"} | ||
$a_{\text{min}}\ = \ $ { 0. } | $a_{\text{min}}\ = \ $ { 0. } | ||
| Line 45: | Line 45: | ||
| − | { | + | {Calculate the phase function $\phi(t)$. What are the phase values at $t = 0$ and $t=25 \ {\rm µ} \text{s}$? <br>Interpret $\phi (t)$ in the range around $t=75 \ {\rm µ} \text{s}$. |
|type="{}"} | |type="{}"} | ||
| − | $\phi(t=0 \ {\rm µ} \text{s})\ = \ $ { -46--44 } $\text{ | + | $\phi(t=0 \ {\rm µ} \text{s})\ = \ $ { -46--44 } $\text{deg}$ |
| − | $\phi(t=25 \ {\rm µ} \text{s})\ = \ $ { 0. } $\text{ | + | $\phi(t=25 \ {\rm µ} \text{s})\ = \ $ { 0. } $\text{deg}$ |
| − | $\phi(t=75 \ {\rm µ} \text{s})\ = \ $ { 0. } $\text{ | + | $\phi(t=75 \ {\rm µ} \text{s})\ = \ $ { 0. } $\text{deg}$ |
| − | { | + | {Give the equivalent low-pass signal $s_{\rm TP}(t)$ für $f_{\rm T} = 60 \ \text{kHz} = f_{60}$ an. Which of the following statements are true? |
|type="[]"} | |type="[]"} | ||
| − | + | + | + The locus curve is a circle with radius $1$ around the centre $(0, –{\rm j})$ . |
| − | - | + | - Now $s_{\rm TP}(t = 0) = 1 + {\rm j}$ applies. |
| − | + | + | + The magnitude function $a(t)$ is unchanged compared to $f_{\rm T} = f_{50}$ . |
| − | - | + | - The phase function $\phi (t)$ is unchanged compared to $f_{\rm T} = f_{50}$ . |
</quiz> | </quiz> | ||
| − | === | + | ===Solution=== |
{{ML-Kopf}} | {{ML-Kopf}} | ||
[[File:P_ID766__Sig_A_4_6_a.png|250px|right|frame|Ortskurve für OSB]] | [[File:P_ID766__Sig_A_4_6_a.png|250px|right|frame|Ortskurve für OSB]] | ||
| − | '''(1)''' | + | '''(1)''' <u>Proposed solution 2</u> is correct: |
| − | * | + | *The spectrum of the equivalent LP signal signal with carrier frequency $f_{\rm T} = f_{50} = 50 \ \text{kHz}$: |
:$$S_{\rm TP}(f ) = S_{\rm +}(f+ f_{\rm 50}) = 1 \cdot \delta (f)- | :$$S_{\rm TP}(f ) = S_{\rm +}(f+ f_{\rm 50}) = 1 \cdot \delta (f)- | ||
{\rm j} \cdot \delta (f - f_{\rm 10}) .$$ | {\rm j} \cdot \delta (f - f_{\rm 10}) .$$ | ||
| − | * | + | *This gives for the associated time signal: |
:$$s_{\rm TP}(t) = {\rm 1 } - {\rm j} \cdot {\rm e}^{{\rm | :$$s_{\rm TP}(t) = {\rm 1 } - {\rm j} \cdot {\rm e}^{{\rm | ||
j}\hspace{0.05cm} \omega_{\rm 10} \hspace{0.05cm} t }.$$ | j}\hspace{0.05cm} \omega_{\rm 10} \hspace{0.05cm} t }.$$ | ||
| − | * | + | *Starting from the point $(1, –{\rm j})$ $s_{\rm TP}(t)$ runs on a circle with centre $(1, 0)$ and radius $1$. |
| − | * | + | *The period is equal to the reciprocal of the frequency: $T_0 = 1/f_{10} = 100 \ µ \text{s}$ ⇒ <u>Answer 2</u>. |
| − | '''(2)''' | + | '''(2)''' Splitting the above equation into real and imaginary parts, we get: |
:$$s_{\rm TP}(t) = {\rm 1 } + \sin({ \omega_{\rm 10} \hspace{0.05cm} t }) | :$$s_{\rm TP}(t) = {\rm 1 } + \sin({ \omega_{\rm 10} \hspace{0.05cm} t }) | ||
-{\rm j}\cdot \cos({ \omega_{\rm 10} \hspace{0.05cm} t }).$$ | -{\rm j}\cdot \cos({ \omega_{\rm 10} \hspace{0.05cm} t }).$$ | ||
| − | * | + | *This leads to the magnitude function |
:$$a(t)= |s_{\rm TP}(t)|=\sqrt{{\rm Re}\left[s_{\rm | :$$a(t)= |s_{\rm TP}(t)|=\sqrt{{\rm Re}\left[s_{\rm | ||
| Line 90: | Line 90: | ||
= \sqrt{2 \cdot ( 1 + \sin(\omega_{\rm 10}\hspace{0.05cm} t))}.$$ | = \sqrt{2 \cdot ( 1 + \sin(\omega_{\rm 10}\hspace{0.05cm} t))}.$$ | ||
| − | * | + | *For the minimum value, considering $\sin(\omega_{10} \cdot t) \geq -1$ ⇒ $a_{\text{min}} \; \underline{= 0}$ is obtained.. |
| − | * | + | *The maximum value is obtained from $\sin(\omega_{10} \cdot t \leq 1$ ) ⇒ $a_{\text{max}} \; \underline{= 2}$. |
| − | * | + | *At $t = 0$ , the magnitude is equal to $a_0 = \sqrt{2 }\; \underline{\approx 1.414}$. |
| − | '''(3)''' | + | '''(3)''' According to the general definition: |
:$$\phi(t)= {\rm arctan} \hspace{0.1cm}\frac{{\rm Im}\left[s_{\rm | :$$\phi(t)= {\rm arctan} \hspace{0.1cm}\frac{{\rm Im}\left[s_{\rm | ||
| Line 103: | Line 103: | ||
\sin(\omega_{\rm 10}\hspace{0.05cm} t)}.$$ | \sin(\omega_{\rm 10}\hspace{0.05cm} t)}.$$ | ||
| − | * | + | *For $t = 0$ $\cos( \omega_{10} \cdot t ) = 1$ and $\sin( \omega_{10} \cdot t ) = 0$. It follows: |
:$$\phi(t = 0)= {\rm arctan} (-1) \hspace{0.15 cm}\underline{= -45^\circ}.$$ | :$$\phi(t = 0)= {\rm arctan} (-1) \hspace{0.15 cm}\underline{= -45^\circ}.$$ | ||
| − | * | + | *On the other hand, for $t = T_0/4 =25 \ µ \text{s}$ : |
:$$\cos(\omega_{\rm 10}\hspace{0.05cm} t) = 0; | :$$\cos(\omega_{\rm 10}\hspace{0.05cm} t) = 0; | ||
| Line 114: | Line 114: | ||
\hspace{0.05cm} µ s}) \hspace{0.15 cm}\underline{= 0}.$$ | \hspace{0.05cm} µ s}) \hspace{0.15 cm}\underline{= 0}.$$ | ||
| − | * | + | *The two angles calculated so far can also be read from the graph above. |
| − | + | The phase value at $t =75 \ µ \text{s}$ , on the other hand, must be determined by boundary crossing, since here both the real and imaginary parts become zero and thus the argument of the arctan function is indeterminate. One obtains $\phi(t=75 \ µ \text{s}) \; \underline{= 0}.$ This result is to be verified numerically here: | |
| − | * | + | *If one calculates the phase function for $t =74 \ {\rm µ} \text{s}$, so erhält man mit $\omega_{10} \cdot t = 1.48 \cdot \pi \; \Rightarrow \; 266.4^\circ$: |
:$$\phi(t = {\rm 74 \hspace{0.05cm} {\rm µ} s})= {\rm arctan} | :$$\phi(t = {\rm 74 \hspace{0.05cm} {\rm µ} s})= {\rm arctan} | ||
| Line 125: | Line 125: | ||
arctan}(31)\approx 88^\circ.$$ | arctan}(31)\approx 88^\circ.$$ | ||
| − | * | + | *Accordingly, for $t =76 \ {\rm µ} \text{s}$ with $\omega_{10} \cdot t = 1.52 \cdot \pi \; \Rightarrow \; 273.6^\circ$ : |
:$$\phi(t = {\rm 76 \hspace{0.05cm} {\rm µ} s})= {\rm arctan} | :$$\phi(t = {\rm 76 \hspace{0.05cm} {\rm µ} s})= {\rm arctan} | ||
| Line 131: | Line 131: | ||
\approx {\rm arctan}(-31)\approx -88^\circ.$$ | \approx {\rm arctan}(-31)\approx -88^\circ.$$ | ||
| − | * | + | *The numerical values suggest that the limit values for $t \; \rightarrow \; 75 \ {\rm µ} \text{s}$ result in $\pm 90^\circ$ depending on whether this value is approached from above or below. |
| − | * | + | *The phase value at exactly $t =75 \ {\rm µ} \text{s}$ is equal to the mean value between the right-hand and left-hand limit values, i.e. actually zero. |
| − | [[File:P_ID767__Sig_A_4_6_d.png|250px|right|frame| | + | [[File:P_ID767__Sig_A_4_6_d.png|250px|right|frame|Locus curve for LSB]] |
| − | '''(4)''' | + | '''(4)''' With the carrier frequency $f_{\rm T} = f_{60} = 60 \ \text{ kHz}$ the equations for time and frequency domain are: |
:$$S_{\rm TP}(f ) = S_{\rm +}(f+ f_{\rm 60}) = -{\rm j} \cdot \delta | :$$S_{\rm TP}(f ) = S_{\rm +}(f+ f_{\rm 60}) = -{\rm j} \cdot \delta | ||
| Line 144: | Line 144: | ||
j}\hspace{0.05cm} \omega_{\rm 10} \hspace{0.05cm} t }.$$ | j}\hspace{0.05cm} \omega_{\rm 10} \hspace{0.05cm} t }.$$ | ||
| − | In | + | In the graph, $s_{\rm TP}(t)$ is shown. It can be seen: |
| − | * | + | *The locus curve is again a circle with radius $1$, but now with centre $(0, –{\rm j})$. |
| − | * | + | *Here, too $s_{\rm TP}(t = 0) = 1 - {\rm j}$ applies. |
| − | * | + | *You now move clockwise on the locus curve.. |
| − | * | + | *The period continues to be $T_0 = 1/f_{10} = 100 \ µ \text{s}$. |
| − | * | + | *The locus curve is now rotated by $90^\circ$ in the complex plane compared to sub-task '''(1)''' nun . |
| − | * | + | *For all times, the same pointer lengths result as for $f_{\rm T} = f_{50}$. The magnitude remains the same. |
| − | * | + | *The phase function $\phi(t)$ now yields values between $-\pi$ and zero, while the phase function calculated in subtask '''(3)''' has assumed values between $-\pi/2$ and $+\pi /2$ . It is valid for all times $t$: |
| − | :$$\phi_{\rm | + | :$$\phi_{\rm subtask \ (4)}= -(\phi_{\rm subtask \ (3)} + 90^\circ).$$ |
| − | + | <u>The first and third suggested solutions</u> are therefore correct. | |
{{ML-Fuß}} | {{ML-Fuß}} | ||
__NOEDITSECTION__ | __NOEDITSECTION__ | ||
[[Category:Exercises for Signal Representation|^4.3 Equivalent Low Pass Signal and Its Spectral Function^]] | [[Category:Exercises for Signal Representation|^4.3 Equivalent Low Pass Signal and Its Spectral Function^]] | ||
Revision as of 22:40, 15 February 2021
We consider the analytical signal $s_+(t)$ with the spectral function
- $$S_{\rm +}(f) = 1 \cdot \delta (f - f_{\rm 50})- {\rm j} \cdot \delta (f - f_{\rm 60}) .$$
Here $f_{50}$ and $f_{60}$ are abbreviations for the frequencies $50 \ \rm kHz$ and $60 \ \rm kHz$ respectively.
In this task, the course of the equivalent low-pass signal $s_{\rm TP}(t)$ , which is also referred to as the „locus curve” in this tutorial.
- In subtasks (1) to (3) , we assume that the signal $s(t)$ is produced by a single sideband amplitude modulation of the sinusoidal message signal of frequency $f_{\rm N} = 10 \ \text{ kHz}$ with a cosinusoidal carrier at $f_{\rm T} = f_{50}$ , whereby only the upper sideband is transmitted („USB modulation”).
- In contrast, subtask (4) assumes the carrier frequency $f_{\rm T} = f_{60}$ . This assumption presupposes that LSB modulation has taken place.
Hints:
- This task belongs to the chapter Equivalent Low Pass Signal and Its Spectral Function.
- You can check your solution with the interactive applet Physical signal & equivalent LP signal ⇒ locus curve.
Questions
Solution
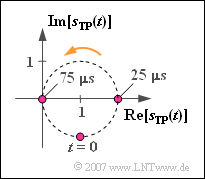
(1) Proposed solution 2 is correct:
- The spectrum of the equivalent LP signal signal with carrier frequency $f_{\rm T} = f_{50} = 50 \ \text{kHz}$:
- $$S_{\rm TP}(f ) = S_{\rm +}(f+ f_{\rm 50}) = 1 \cdot \delta (f)- {\rm j} \cdot \delta (f - f_{\rm 10}) .$$
- This gives for the associated time signal:
- $$s_{\rm TP}(t) = {\rm 1 } - {\rm j} \cdot {\rm e}^{{\rm j}\hspace{0.05cm} \omega_{\rm 10} \hspace{0.05cm} t }.$$
- Starting from the point $(1, –{\rm j})$ $s_{\rm TP}(t)$ runs on a circle with centre $(1, 0)$ and radius $1$.
- The period is equal to the reciprocal of the frequency: $T_0 = 1/f_{10} = 100 \ µ \text{s}$ ⇒ Answer 2.
(2) Splitting the above equation into real and imaginary parts, we get:
- $$s_{\rm TP}(t) = {\rm 1 } + \sin({ \omega_{\rm 10} \hspace{0.05cm} t }) -{\rm j}\cdot \cos({ \omega_{\rm 10} \hspace{0.05cm} t }).$$
- This leads to the magnitude function
- $$a(t)= |s_{\rm TP}(t)|=\sqrt{{\rm Re}\left[s_{\rm TP}(t)\right]^2 + {\rm Im}\left[s_{\rm TP}(t)\right]^2 }= \sqrt{1 + 2 \sin(\omega_{\rm 10}\hspace{0.05cm} t)+ \sin^2(\omega_{\rm 10}\hspace{0.05cm} t)+ \cos^2(\omega_{\rm 10}\hspace{0.05cm} t)} = \sqrt{2 \cdot ( 1 + \sin(\omega_{\rm 10}\hspace{0.05cm} t))}.$$
- For the minimum value, considering $\sin(\omega_{10} \cdot t) \geq -1$ ⇒ $a_{\text{min}} \; \underline{= 0}$ is obtained..
- The maximum value is obtained from $\sin(\omega_{10} \cdot t \leq 1$ ) ⇒ $a_{\text{max}} \; \underline{= 2}$.
- At $t = 0$ , the magnitude is equal to $a_0 = \sqrt{2 }\; \underline{\approx 1.414}$.
(3) According to the general definition:
- $$\phi(t)= {\rm arctan} \hspace{0.1cm}\frac{{\rm Im}\left[s_{\rm TP}(t)\right]}{{\rm Re}\left[s_{\rm TP}(t)\right]}= {\rm arctan} \hspace{0.1cm}\frac{-\cos(\omega_{\rm 10}\hspace{0.05cm} t)}{1 + \sin(\omega_{\rm 10}\hspace{0.05cm} t)}.$$
- For $t = 0$ $\cos( \omega_{10} \cdot t ) = 1$ and $\sin( \omega_{10} \cdot t ) = 0$. It follows:
- $$\phi(t = 0)= {\rm arctan} (-1) \hspace{0.15 cm}\underline{= -45^\circ}.$$
- On the other hand, for $t = T_0/4 =25 \ µ \text{s}$ :
- $$\cos(\omega_{\rm 10}\hspace{0.05cm} t) = 0; \hspace{0.2cm}\sin(\omega_{\rm 10}\hspace{0.05cm} t) = 1 \hspace{0.3cm} \Rightarrow \hspace{0.3cm}\phi(t = {\rm 25 \hspace{0.05cm} µ s}) \hspace{0.15 cm}\underline{= 0}.$$
- The two angles calculated so far can also be read from the graph above.
The phase value at $t =75 \ µ \text{s}$ , on the other hand, must be determined by boundary crossing, since here both the real and imaginary parts become zero and thus the argument of the arctan function is indeterminate. One obtains $\phi(t=75 \ µ \text{s}) \; \underline{= 0}.$ This result is to be verified numerically here:
- If one calculates the phase function for $t =74 \ {\rm µ} \text{s}$, so erhält man mit $\omega_{10} \cdot t = 1.48 \cdot \pi \; \Rightarrow \; 266.4^\circ$:
- $$\phi(t = {\rm 74 \hspace{0.05cm} {\rm µ} s})= {\rm arctan} \hspace{0.1cm}\frac{\cos(86.4^\circ)}{1 - \sin(86.4^\circ)} = {\rm arctan} \hspace{0.1cm}\frac{0.062}{1 - 0.998} \approx {\rm arctan}(31)\approx 88^\circ.$$
- Accordingly, for $t =76 \ {\rm µ} \text{s}$ with $\omega_{10} \cdot t = 1.52 \cdot \pi \; \Rightarrow \; 273.6^\circ$ :
- $$\phi(t = {\rm 76 \hspace{0.05cm} {\rm µ} s})= {\rm arctan} \hspace{0.1cm}\frac{-\cos(86.4^\circ)}{1 - \sin(86.4^\circ)} \approx {\rm arctan}(-31)\approx -88^\circ.$$
- The numerical values suggest that the limit values for $t \; \rightarrow \; 75 \ {\rm µ} \text{s}$ result in $\pm 90^\circ$ depending on whether this value is approached from above or below.
- The phase value at exactly $t =75 \ {\rm µ} \text{s}$ is equal to the mean value between the right-hand and left-hand limit values, i.e. actually zero.
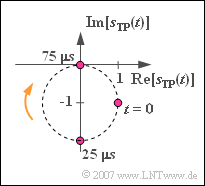
(4) With the carrier frequency $f_{\rm T} = f_{60} = 60 \ \text{ kHz}$ the equations for time and frequency domain are:
- $$S_{\rm TP}(f ) = S_{\rm +}(f+ f_{\rm 60}) = -{\rm j} \cdot \delta (f) + \delta (f + f_{\rm 10}) ;$$
- $$s_{\rm TP}(t) = - {\rm j} + 1 \cdot {\rm e}^{-{\rm j}\hspace{0.05cm} \omega_{\rm 10} \hspace{0.05cm} t }.$$
In the graph, $s_{\rm TP}(t)$ is shown. It can be seen:
- The locus curve is again a circle with radius $1$, but now with centre $(0, –{\rm j})$.
- Here, too $s_{\rm TP}(t = 0) = 1 - {\rm j}$ applies.
- You now move clockwise on the locus curve..
- The period continues to be $T_0 = 1/f_{10} = 100 \ µ \text{s}$.
- The locus curve is now rotated by $90^\circ$ in the complex plane compared to sub-task (1) nun .
- For all times, the same pointer lengths result as for $f_{\rm T} = f_{50}$. The magnitude remains the same.
- The phase function $\phi(t)$ now yields values between $-\pi$ and zero, while the phase function calculated in subtask (3) has assumed values between $-\pi/2$ and $+\pi /2$ . It is valid for all times $t$:
- $$\phi_{\rm subtask \ (4)}= -(\phi_{\rm subtask \ (3)} + 90^\circ).$$
The first and third suggested solutions are therefore correct.


