Difference between revisions of "Linear and Time Invariant Systems/Classification of the Distortions"
| Line 85: | Line 85: | ||
==Quantitative Measure of Signal Distortion== | ==Quantitative Measure of Signal Distortion== | ||
<br> | <br> | ||
| − | We now consider a distortive system on the basis of the input and output signal. In doing so, we | + | We now consider a distortive system on the basis of the input and output signal. In doing so, we assume that apart from the signal distortions theres is no additional constant damping factor for all frequencies $α$ and no transit time $τ$ that is constant for all frequencies. These conditions are fulfilled for the signal sections sketched below. |
[[File:P_ID875__LZI_T_2_1_S3_neu.png|right|frame|Input and output of a distortive system and error signal (below)|class=fit]] | [[File:P_ID875__LZI_T_2_1_S3_neu.png|right|frame|Input and output of a distortive system and error signal (below)|class=fit]] | ||
Revision as of 21:20, 10 May 2021
Contents
- 1 # OVERVIEW OF THE SECOND MAIN CHAPTER #
- 2 Prerequisites for the Entire Second Main Chapter
- 3 Ideal and Distortion-free System
- 4 Quantitative Measure of Signal Distortion
- 5 Berücksichtigung von Dämpfung und Laufzeit
- 6 Lineare und nichtlineare Verzerrungen
- 7 Aufgaben zum Kapitel
- 8 Quellenverzeichnis
# OVERVIEW OF THE SECOND MAIN CHAPTER #
$\text{Definition:}$ Generally, undesirable deterministic changes of a message signal by a transmission system are considered as distortions .
In addition to stochastic interferences (noise, crosstalk, etc.), such deterministic distortions are a critical limitation on transmission quality and rate for many messaging systems.
This chapter presents these distortions in a summarising way, in particular:
- the quantitative detection of such signal falsifications via the distortion power,
- the distinguishing features between nonlinear and linear distortions,
- the meaning and computation of the distortion factor in nonlinear systems and
- the effects of linear distortions of attenuation and phase distortions.
Further information on the topic of "distortions" as well as tasks, simulations and programming exercises can be found in
- Chapter 6: Linear Time-Invariant Systems (Programme lzi)
of the practical course "Simulation Methods in Communications Engineering". This (former) LNT course at TU Munich is based on
- the educational software package LNTsim ⇒ Link refers to the ZIP-version of the programme, and
- this practical course guide Praktikumsanleitung ⇒ Link refers to the PDF-version; Chapter 6: pages 99-118.
Prerequisites for the Entire Second Main Chapter
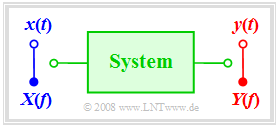
In the following, we consider a system whose input is the signal $x(t)$ with the corresponding spectrum $X(f)$ . The output signal is denoted by $y(t)$ and its spectrum by $Y(f).$
The block labelled "system" can be a part of an electrical circuit or a complete transmission system consisting of transmitter, channel and receiver.
For the whole main chapter ”Signal Distortions and Equalisation” the following shall apply:
- The system be time-invariant. If the input signal $x(t)$ results in the output signal $y(t)$, then a later input signal of the same form – in particular $x(t - t_0)$ – will result in the signal $y(t - t_0)$ .
- No noise is considered, which is always present in real systems. For the description of these phenomena we refer to the $\rm LNTwww$–book Stochastische Signaltheorie.
- No detailed knowledge about the system is assumed. In the following, all system properties are derived from the signals $x(t)$ and $y(t)$ or their spectra alone.
- In particular, no specifications are given with regards to linearity for the time being. The "system" can be linear (prerequisite for the application of the superposition principle) or non-linear.
- Not all system properties are discernible from a single test signal $x(t)$ and its response $y(t)$ . Therefore, sufficiently many test signals must be used for evaluation.
In the following, we will classify transmission systems in more detail in this respect.
Ideal and Distortion-free System
$\text{Definition:}$ One deals with an ideal system if the output signal $y(t)$ is exactly equal to the input signal $x(t)$ :
- $$y(t) \equiv x(t).$$
It should be noted that such an ideal system does not exist in reality even if statistical disturbances and noise processes, that always exist but are not considered in this book, are disregarded. Every transmission medium exhibits losses (attenuations) and transit times. Even if these physical phenomena are very small, they are never zero. It is therefore necessary to introduce a somewhat less strict quality characteristic.
$\text{Definition:}$ A distortion-free system exists if the following condition is fulfilled:
- $$y(t) = \alpha \cdot x(t - \tau).$$
Here, $α$ describes the damping factor and $τ$ the transit time.
If this condition is not met, the system is said to be distortive.
$\text{Example 1:}$ The following graph shows the input signal $x(t)$ and the output signal $y(t)$ of a nonideal but distortion-free system. The system parameters are $α = 0.8$ and $τ = 0.25 \ \rm ms$.
Note:
- The damping factor $α$ can be completely reversed by a receiver-side gain of $1/α = 1.25$, but it must be taken into account that this also increases any noise.
- However, the transit time $τ$ cannot be compensated due to Kausalitätsgründen . It now depends on the application whether such a transit time is subjectively perceived as disturbing or not.
For example, even with a transit time of one second the (unidirectional) TV broadcast of an event is still described as "live". In contrast to this, transit times of $\text{300 ms}$ are already perceived as very disturbing in bidirectional communication – for example, a telephone call. You either wait for the other person to react or both participants interrupt each other.
Quantitative Measure of Signal Distortion
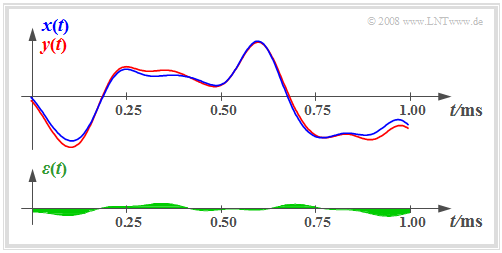
We now consider a distortive system on the basis of the input and output signal. In doing so, we assume that apart from the signal distortions theres is no additional constant damping factor for all frequencies $α$ and no transit time $τ$ that is constant for all frequencies. These conditions are fulfilled for the signal sections sketched below.
In der Grafik ist zusätzlich zu den Signalen $x(t)$ und $y(t)$ auch das Differenzsignal eingezeichnet:
- $$\varepsilon(t) = y(t) - x(t).$$
Als quantitatives Maß für die Stärke der Verzerrungen eignet sich zum Beispiel der quadratische Mittelwert dieses Differenzsignals:
- $$\overline{\varepsilon^2(t)} = \frac{1}{T_{\rm M}} \cdot \int_{ 0 }^{ T_{\rm M}} {\varepsilon^2(t) }\hspace{0.1cm}{\rm d}t\hspace{0.4cm} \left( = P_{\rm V} \right).$$
Zu dieser Gleichung ist Folgendes anzumerken:
- Die Messdauer $T_{\rm M}$ muss hinreichend groß gewählt werden. Eigentlich müsste diese Gleichung mit Grenzübergang formuliert werden.
- Der oben angegebene quadratische Mittelwert wird oft auch als der mittlere quadratische Fehler $\rm (MQF)$ oder als die Verzerrungsleistung $P_{\rm V}$ bezeichnet.
- Sind $x(t)$ und $y(t)$ Spannungssignale, so besitzt $P_{\rm V}$ die Einheit ${\rm V}^2$, das heißt, die Leistung ist nach obiger Definition auf den Widerstand $R = 1 \ Ω$ bezogen.
$\text{Definition:}$ Mit der (auf $R = 1 \ Ω$ bezogenen) Leistung $P_x$ des Eingangssignals $x(t)$ kann das Signal–zu–Verzerrungs–Leistungsverhältnis angegeben werden:
- $$\rho_{\rm V} = \frac{ P_{x} }{P_{\rm V} } \hspace{0.3cm} \Rightarrow \hspace{0.3cm} 10 \cdot \lg \hspace{0.1cm}\rho_{\rm V} = 10 \cdot \lg \hspace{0.1cm}\frac{ P_{x} }{P_{\rm V} }\hspace{0.3cm} \left( {\rm in \hspace{0.15cm} dB} \right).$$
Bei den in der oberen Grafik dargestellten Signalen gilt $P_x = 4 \ {\rm V}^2$, $P_{\rm V} = 0.04 \ {\rm V}^2$ und damit $10 \cdot {\rm lg} \ ρ_{\rm V} = 20 \ \rm dB$.
Wir verweisen auf das interaktive Applet Lineare Verzerrungen periodischer Signale.
Berücksichtigung von Dämpfung und Laufzeit
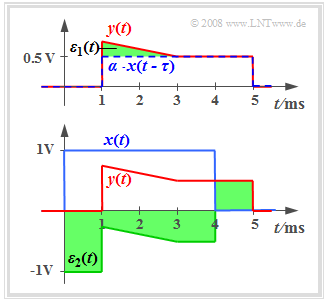
Die auf der letzten Seite angegebenen Gleichungen führen dann nicht zu verwertbaren Aussagen, wenn zusätzlich eine Dämpfung $α$ und/oder eine Laufzeit $τ$ im System wirksam ist. Die Grafik zeigt das gedämpfte, verzögerte und verzerrte Signal
- $$y(t) = \alpha \cdot x(t - \tau) + \varepsilon_1(t).$$
Im Term $ε_1(t)$ sind alle Verzerrungen zusammengefasst. Man erkennt an der grünen Fläche, dass das Fehlersignal $ε_1(t)$ relativ klein ist.
Sind dagegen die Dämpfung $α$ und die Laufzeit $τ$ unbekannt, so ist Folgendes zu beachten:
- Das so ermittelte Fehlersignal $ε_2(t) = y(t) - x(t)$ ist trotz kleiner Verzerrungen $ε_1(t)$ relativ groß.
- Anstelle der Verzerrungsleistung muss hier die Verzerrungsenergie betrachtet werden, da $x(t)$ und $y(t)$ energiebegrenzte Signale sind.
- Die Verzerrungsenergie erhält man, in dem man die unbekannten Größen $α$ und $τ$ variiert und auf diese Weise das Minimum des mittleren quadratischen Fehlers ermittelt:
- $$E_{\rm V} = \min_{\alpha, \ \tau} \int_{ - \infty }^{ + \infty} {\big[y(t) - \left(\alpha \cdot x(t - \tau) \right) \big]^2}\hspace{0.1cm}{\rm d}t.$$
- Die Energie des gedämpften und verzögerten Signals $α · x(t - τ)$ ist unabhängig von der Laufzeit $τ$ gleich $α^2 · E_x$. Für das Signal–zu–Verzerrungs–Leistungsverhältnis gilt somit:
- $$\rho_{\rm V} = \frac{ \alpha^2 \cdot E_{x}}{E_{\rm V}}\hspace{0.3cm}{\rm bzw.}\hspace{0.3cm}\rho_{\rm V}= \frac{ \alpha^2 \cdot P_{x}}{P_{\rm V}} .$$
- Die erste dieser beiden Gleichungen gilt für zeitlich begrenzte und damit energiebegrenzte Signale, die zweite für zeitlich unbegrenzte, also leistungsbegrenzte Signale entsprechend der Seite Energiebegrenzte und leistungsbegrenzte Signale im Buch „Signaldarstellung”.
Lineare und nichtlineare Verzerrungen
Man unterscheidet zwischen linearen und nichtlinearen Verzerrungen:
Ist das System linear und zeitinvariant $(\rm LZI)$, so wird es vollständig durch seinen Frequenzgang $H(f)$ charakterisiert, und es lässt sich Folgendes feststellen:
- Entspechend der $H(f)$–Definition gilt für das Ausgangsspektrum: $Y(f)=X(f) · H(f)$. Daraus folgt nach den Rechenregeln der Multiplkation, dass $Y(f)$ keine Frequenzanteile beinhalten kann, die nicht schon in $X(f)$ enthalten sind.
- Die Umkehrung besagt: Das Ausgangssignal $y(t)$ kann jede Frequenz $f_0$ beinhalten, die bereits im Eingangssignal $x(t)$ enthalten ist. Voraussetzung ist also, dass $X(f_0) ≠ 0$ gilt.
- Bei einem LZI–System ist die absolute Bandbreite $(B_y)$ des Ausgangssignals nie größer als die Bandbreite $(B_x)$ des Eingangssignals: $B_y \le B_x .$
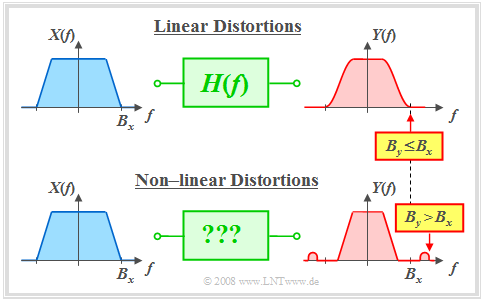
$\text{Fazit:}$ Die Unterschiede zwischen linearen und nichtlinearen Verzerrungen sollen anhand einses Schaubildes verdeutlicht werden:
- In der oberen Grafik gilt $B_y = B_x$. Es liegen lineare Verzerrungen vor, da sich in diesem Frequenzband $X(f)$ und $Y(f)$ unterscheiden.
- Eine Bandbegrenzung $(B_y < B_x)$ ist eine Sonderform linearer Verzerrungen, die im übernächsten Kapitel behandelt werden.
- Die untere Grafik zeigt ein Beispiel für nichtlineare Verzerrungen $(B_y > B_x)$. Für ein solches System kann kein Frequenzgang $H(f)$ angegeben werden.
- Welche Beschreibungsgrößen für nichtlineare Systeme geeignet sind, wird im nächsten Kapitel Nichtlineare Verzerrungen dargelegt.
Bei den meisten realen Übertragungskanälen treten sowohl lineare als auch nichtlineare Verzerrungen auf. Für eine ganze Reihe von Problemstellungen ist jedoch die klare Trennung der beiden Verzerrungsarten essentiell. In [Kam04][1] wird ein entsprechendes Ersatzmodell angegeben.
Wir verweisen hier auf das Lernvideo Lineare und nichtlineare Verzerrungen .
Aufgaben zum Kapitel
Aufgabe 2.1: Linear? - Nichtlinear?
Aufgabe 2.1Z: Verzerrung und Entzerrung
Aufgabe 2.2: Verzerrungsleistung
Aufgabe 2.2Z: Nochmals Verzerrungsleistung
Quellenverzeichnis
- ↑ Kammeyer, K.D.: Nachrichtenübertragung. Stuttgart: B.G. Teubner, 4. Auflage, 2004.


