Difference between revisions of "Aufgaben:Exercise 2.2: Multi-Level Signals"
From LNTwww
| Line 3: | Line 3: | ||
}} | }} | ||
| − | |||
| − | |||
| + | [[File:P_ID85__Sto_A_2_2.png|right|frame|Two similar multilevel signals]] | ||
| + | Let the square wave signal $x(t)$ be dimensionless and can only have the current values $0, \ 1, \ 2, \ \text{...} \ , \ M-2, \ M-1$ with equal probability. The upper graph shows this signal for the special case $M = 5$. | ||
| − | |||
| + | The square wave signal $y(t)$ is also $M$–stepped, but zero mean and restricted to the range from $y > -y_0$ to $y < +y_0$ . | ||
| − | |||
| + | In the graph below you can see the signal $y(t)$, again for the number of steps $M = 5$. | ||
| Line 18: | Line 18: | ||
| − | + | ||
| − | * | + | |
| + | |||
| + | Hints: | ||
| + | *The exercise belongs to the chapter [[Theory_of_Stochastic_Signals/Momente_einer_diskreten_Zufallsgröße|Moments of a Discrete Random Variable]]. | ||
| − | * | + | **The topic of this chapter is illustrated with examples in the (German language) learning video<br> [[Momentenberechnung_bei_diskreten_Zufallsgrößen_(Lernvideo)|Calculating Moments for Discrete-Valued Random Variables ]] $\Rightarrow$ |
| − | * | + | *Fur numerical calculations, use $y_0 = 2\hspace{0.05cm}V$. |
| Line 28: | Line 31: | ||
| − | === | + | ===Questions=== |
<quiz display=simple> | <quiz display=simple> | ||
| − | { | + | {What is the linear mean $m_x$ of the random variable $x$ for $M= 5$? |
|type="{}"} | |type="{}"} | ||
| − | $m_x \ = \ $ | + | $m_x \ = \ $ { 2 3% } |
| − | { | + | {What is the variance $\sigma_x^2$ of the random variable $x$ in general and für $M= 5$? |
|type="{}"} | |type="{}"} | ||
$\sigma_x^2\ = \ $ { 2 3% } | $\sigma_x^2\ = \ $ { 2 3% } | ||
| − | { | + | {Calculate the mean $m_y$ of the random variable $y$ für $M= 5$. |
|type="{}"} | |type="{}"} | ||
$m_y \ = \ $ { 0. } $\ \rm V$ | $m_y \ = \ $ { 0. } $\ \rm V$ | ||
| − | { | + | {What is the variance $\sigma_y^2$ of the random variable $y$? Consider the result from '''(2)'''. What is the value again for $M= 5$? |
|type="{}"} | |type="{}"} | ||
$\sigma_y^2\ = \ $ { 2 3% } $\ \rm V^2$ | $\sigma_y^2\ = \ $ { 2 3% } $\ \rm V^2$ | ||
| Line 53: | Line 56: | ||
</quiz> | </quiz> | ||
| + | |||
===Musterlösung=== | ===Musterlösung=== | ||
Revision as of 19:33, 3 December 2021
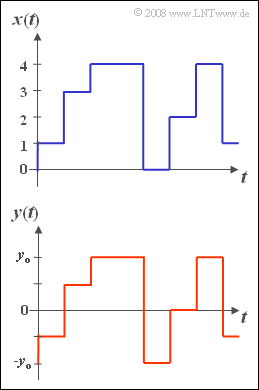
Let the square wave signal $x(t)$ be dimensionless and can only have the current values $0, \ 1, \ 2, \ \text{...} \ , \ M-2, \ M-1$ with equal probability. The upper graph shows this signal for the special case $M = 5$.
The square wave signal $y(t)$ is also $M$–stepped, but zero mean and restricted to the range from $y > -y_0$ to $y < +y_0$ .
In the graph below you can see the signal $y(t)$, again for the number of steps $M = 5$.
Hints:
- The exercise belongs to the chapter Moments of a Discrete Random Variable.
- The topic of this chapter is illustrated with examples in the (German language) learning video
Calculating Moments for Discrete-Valued Random Variables $\Rightarrow$
- The topic of this chapter is illustrated with examples in the (German language) learning video
- Fur numerical calculations, use $y_0 = 2\hspace{0.05cm}V$.
Questions
Musterlösung
(1) Man erhält durch Mittelung über alle möglichen Signalwerte für den linearen Mittelwert:
- $$m_{\it x}=\rm \sum_{\mu=0}^{\it M-{\rm 1}} \it p_\mu\cdot x_{\mu}=\frac{\rm 1}{\it M} \cdot \sum_{\mu=\rm 0}^{\it M-\rm 1}\mu=\frac{\rm 1}{\it M}\cdot\frac{(\it M-\rm 1)\cdot \it M}{\rm 2}=\frac{\it M-\rm 1}{\rm 2}.$$
- Im Sonderfall $M= 5$ ergibt sich der lineare Mittelwert zu $m_x \;\underline{= 2}$.
(2) Analog gilt für den quadratischen Mittelwert:
- $$m_{\rm 2\it x}= \rm \sum_{\mu=0}^{\it M -\rm 1}\it p_\mu\cdot x_{\mu}^{\rm 2}=\frac{\rm 1}{\it M}\cdot \sum_{\mu=\rm 0}^{\rm M-1}\mu^{\rm 2} = \frac{\rm 1}{\it M}\cdot\frac{(\it M-\rm 1)\cdot \it M\cdot(\rm 2\it M-\rm 1)}{\rm 6} = \frac{(\it M-\rm 1)\cdot(\rm 2\it M-\rm 1)}{\rm 6}.$$
- Im Sonderfall $M= 5$ ergibt sich der quadratische Mittelwert zu $m_{2x} {=6}$.
- Daraus kann die Varianz mit dem Satz von Steiner berechnet werden:
- $$\sigma_x^{\rm 2}=m_{\rm 2\it x}-m_x^{\rm 2}=\frac{(\it M-\rm 1)\cdot(\rm 2\it M-\rm 1)}{\rm 6}-\frac{(\it M-\rm 1)^{\rm 2}}{\rm 4}=\frac{\it M^{\rm 2}-\rm 1}{\rm 12}.$$
- Im Sonderfall $M= 5$ ergibt sich für die Varianz $\sigma_x^2 \;\underline{= 2}$.
(3) Aufgrund der Symmetrie von $y$ gilt unabhängig von $M$:
- $$m_x \;\underline{= 2}.$$
(4) Zwischen $x(t)$ und $y(t)$ gilt folgender Zusammenhang:
- $$y(t)=\frac{2\cdot y_{\rm 0}}{M-\rm 1}\cdot \big[x(t)-m_x\big].$$
- Daraus folgt für die Varianzen:
- $$\sigma_y^{\rm 2}=\frac{4\cdot y_{\rm 0}^{\rm 2}}{( M - 1)^{\rm 2}}\cdot \sigma_x^{\rm 2}=\frac{y_{\rm 0}^{\rm 2}\cdot (M^{\rm 2}-1)}{3\cdot (M- 1)^{\rm 2}}=\frac{y_{\rm 0}^{\rm 2}\cdot ( M+ 1)}{ 3\cdot ( M- 1)}.$$
- Im Sonderfall $M= 5$ ergibt sich hierfür:
- $$\it \sigma_y^{\rm 2}= \frac {\it y_{\rm 0}^{\rm 2} \cdot {\rm 6}}{\rm 3 \cdot 4}\hspace{0.15cm} \underline{=\rm2\,V^{2}}.$$
