Difference between revisions of "Aufgaben:Exercise 3.3: Sum of two Oscillations"
m |
m |
||
| Line 49: | Line 49: | ||
*Particular reference is made to the page [[Modulation_Methods/Phase_Modulation_(PM)#Equivalent_low-pass_signal_in_phase_modulation|Equivalent low-pass signal in phase modulation]]. | *Particular reference is made to the page [[Modulation_Methods/Phase_Modulation_(PM)#Equivalent_low-pass_signal_in_phase_modulation|Equivalent low-pass signal in phase modulation]]. | ||
*The values of the Bessel functions can be found in formula collections in table form. | *The values of the Bessel functions can be found in formula collections in table form. | ||
| − | * | + | *You can also use the interactive applet [[Applets:Bessel_functions_of_the_first_kind| Bessel functions of the first kind]] to solve this task. |
| − | === | + | ===Questions=== |
<quiz display=simple> | <quiz display=simple> | ||
Revision as of 16:42, 14 March 2022
The equivalent low-pass signal with phase modulation, when normalized to the carrier amplitude $(A_{\rm T} = 1)$ is:
- $$ s_{\rm TP}(t) = {\rm e}^{\hspace{0.05cm}{\rm j} \hspace{0.05cm}\cdot \hspace{0.05cm}K_{\rm PM}\hspace{0.05cm}\cdot \hspace{0.05cm}q(t) }\hspace{0.05cm},$$
The modulator constant is assumed to be $K_{\rm PM} = \rm 1/V$ throughout the task.
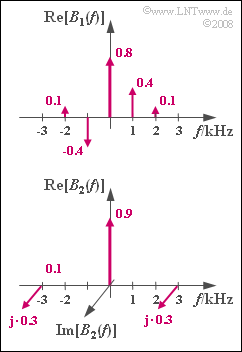
The upper graph shows the corresponding spectral function $B_1(f)$, when the source signal is
- $$q_1(t) = 0.9\,{\rm V} \cdot \sin(2 \pi \cdot 1\,{\rm kHz} \cdot t)$$. The weights of the Bessel-Dirac lines when $η_1 = 0.9$ are obtained as follows:
- $${\rm J}_0 (0.9) = 0.808 \approx 0.8,\hspace{1cm} {\rm J}_1 (0.9) = 0.406 \approx 0.4,$$
- $${\rm J}_2 (0.9) = 0.095 \approx 0.1,\hspace{1cm} {\rm J}_3 (0.9) \approx {\rm J}_4 (0.9) \approx\ \text{ ...} \ \approx 0 \hspace{0.05cm}.$$
Use the approximations given in the graph to simplify the calculations.
The Bessel function $B_2(f)$ is obtained for the source signal
- $$q_2(t) = 0.65\,{\rm V} \cdot \cos(2 \pi \cdot 3\,{\rm kHz} \cdot t)$$
The numerical values of the Dirac lines are obtained from the following:
- $${\rm J}_0 (0.65) = 0.897 \approx 0.9,\hspace{0.3cm}{\rm J}_1 (0.65) = 0.308 \approx 0.3, \hspace{0.3cm}{\rm J}_2 (0.65) = 0.051 \approx 0\hspace{0.05cm}.$$
From the graph, it can be seen that due to the cosine source signal $q_2(t)$ and the cosine carrier signal $z(t)$ , the spectral lines at $±3 \ \rm kHz$ are both positive and imaginary.
In the context of this task, we will now investigate the case where the source signal
- $$q(t) = q_1(t) + q_2(t)$$
is applied to the input of the phase modulator.
- It is worth mentioning that $|q(t)| < q_{\rm max} = 1.45 \ \rm V$ .
- This maximum value is slightly smaller than the sum $A_1 + A_2$ of the individual amplitudes when a sine and a cosine function with the given amplitudes are added up.
In the following questionnaire,
- $S_{\rm TP}(f)$ denotes the spectral function of the equivalent low-pass signal,
- $S_+(f)$ denotes the spectral functions of the analytic signal,
in both cases assuming that $q(t) = q_1(t) + q_2(t)$ holds and that the carrier frequency is $f_{\rm T} = 100 \ \rm kHz$ .
Hints:
- This exercise belongs to the chapter Phase Modulation.
- Particular reference is made to the page Equivalent low-pass signal in phase modulation.
- The values of the Bessel functions can be found in formula collections in table form.
- You can also use the interactive applet Bessel functions of the first kind to solve this task.
Questions
Musterlösung
- Bei Winkelmodulation bewegt sich der komplexe Zeiger $s_{\rm TP}(t)$ stets auf einem Kreisbogen mit folgendem Öffnungswinkel:
- $$2 · K_{\rm PM} · q_{\rm max} = 2 \cdot {\rm 1/V} \cdot 1.45 \ \rm V = 2.9 \ \rm rad \approx 166^\circ.$$
- Mit der (zugegebenermaßen sehr groben) Näherung $166^\circ \approx 180^\circ$ ergibt sich tatsächlich ein Halbkreis.
(2) Es gilt allgemein $S_{\rm TP}(f) = B_1(f) ∗ B_2(f)$.
- Da $B_1(f)$ auf Frequenzen $|f| ≤ 2 \ \rm kHz$ und $B_2(f)$ auf den Bereich $±3 \ \rm kHz$ begrenzt sind, ist das Faltungsprodukt auf $|f| ≤ 5 \ \rm kHz$ beschränkt.
- Daraus folgt:
- $$f_{\rm min} \hspace{0.15cm}\underline {= -5 \ \rm kHz},$$
- $$f_{\rm max} \hspace{0.15cm}\underline {=+5 \ \rm kHz}.$$
(3) Das Faltungsprodukt für die Frequenz $f = 0$ ergibt sich durch Multiplikation von $B_1(f)$ mit $B_2(f)$ und anschließender Summation.
- Nur für $f = 0$ sind sowohl $B_1(f)$ als auch $B_2(f)$ von Null verschieden.
- Damit erhält man:
- $$ S_{\rm TP}(f = 0) = B_{1}(f = 0) \cdot B_{2}(f = 0)= 0.8 \cdot 0.9 \hspace{0.15cm}\underline {= 0.72}\hspace{0.2cm}{\rm (rein \hspace{0.15cm} reell)} \hspace{0.05cm}.$$
(4) Nun muss vor der Multiplikation und Summation noch eine Frequenzverschiebung von $B_2(f)$ nach rechts – oder von $B_1(f)$ nach links – um $1 \ \rm kHz$ erfolgen. Somit erhält man:
- $$S_{\rm TP}(f = 1\,{\rm kHz}) = B_{1}(f = -2\,{\rm kHz}) \cdot B_{2}(f = 3\,{\rm kHz}) + B_{1}(f = 1\,{\rm kHz}) \cdot B_{2}(f = 0) = 0.1 \cdot {\rm j} \cdot 0.3 + 0.4 \cdot 0.9\hspace{0.15cm} = 0.36 + {\rm j} \cdot 0.03$$
- $$\Rightarrow \hspace{0.3cm} {\rm Re}[S_{\rm TP}(f = 1\,{\rm kHz})] \hspace{0.15cm}\underline {= 0.36} \hspace{0.05cm},\hspace{0.3cm} {\rm Im}[S_{\rm TP}(f = 1\,{\rm kHz})] \hspace{0.15cm}\underline {= 0.03} \hspace{0.05cm}.$$
(5) Die Diraclinie $S_+(f = 98 \ \rm kHz)$ entspricht der $S_{\rm TP}(f)$–Linie bei $f = -2 \ \rm kHz$. Diese ist
- $$S_{\rm TP}(f \hspace{-0.05cm}=\hspace{-0.05cm} -2\,{\rm kHz}) \hspace{-0.03cm}=\hspace{-0.03cm} B_{1}(f = -2\,{\rm kHz}) \cdot B_{2}(f \hspace{-0.05cm}=\hspace{-0.05cm} 0) + B_{1}(f \hspace{-0.05cm}=\hspace{-0.05cm} 1\,{\rm kHz}) \cdot B_{2}(f \hspace{-0.05cm}=\hspace{-0.05cm} -3\,{\rm kHz})= 0.1 \cdot 0.9 + 0.4 \cdot {\rm j} \cdot 0.3 \hspace{0.15cm}\hspace{-0.03cm}=\hspace{-0.03cm} 0.09 + {\rm j} \cdot 0.12$$
- $$\Rightarrow \hspace{0.3cm} {\rm Re}[S_{\rm +}(f = 98\,{\rm kHz})] \hspace{0.15cm}\underline {= 0.09} \hspace{0.05cm}, \hspace{0.3cm} {\rm Im}[S_{\rm +}(f = 98\,{\rm kHz})] \hspace{0.15cm}\underline {= 0.12} \hspace{0.05cm}.$$
