Difference between revisions of "Aufgaben:Exercise 3.5: PM and FM for Rectangular Signals"
m |
m |
||
| Line 33: | Line 33: | ||
<quiz display=simple> | <quiz display=simple> | ||
| − | { | + | {Which of the signals is due to phase modulation and which is due to frquency modulation? |
|type="()"} | |type="()"} | ||
| − | - $s_1(t)$ | + | - $s_1(t)$ describes a phase modulation. |
| − | + $s_1(t)$ | + | + $s_1(t)$ describes a frequency modulation. |
| − | { | + | {What is the carrier phase $ϕ_{\rm T}$ that could be measured without a message signal ⇒ $q(t) \equiv 0$ ? |
|type="{}"} | |type="{}"} | ||
$ϕ_{\rm T} \ = \ $ { 0. } $\ \rm Grad$ | $ϕ_{\rm T} \ = \ $ { 0. } $\ \rm Grad$ | ||
| − | { | + | {What carrier frequency $($with respect to $1/T)$ was used in the graphs? |
|type="{}"} | |type="{}"} | ||
$f_{\rm T} · T \ = \ $ { 6 3% } | $f_{\rm T} · T \ = \ $ { 6 3% } | ||
| − | { | + | {The phase of the PM signal is $±90^\circ$. What is the modulator constant? |
|type="{}"} | |type="{}"} | ||
$K_{\rm PM} \ = \ $ { 0.785 3% } $\ \rm V^{-1}$ | $K_{\rm PM} \ = \ $ { 0.785 3% } $\ \rm V^{-1}$ | ||
| − | { | + | {What is the frequency deviation $Δf_{\rm A}$ of the FM signal with respect to $1/T$? |
|type="{}"} | |type="{}"} | ||
$Δf_{\rm A} · T \ = \ $ { 2 3% } | $Δf_{\rm A} · T \ = \ $ { 2 3% } | ||
| − | { | + | {What is the FM modulator constant? |
|type="{}"} | |type="{}"} | ||
$K_{\rm FM} \ = \ $ { 6283 3% } $\ \rm (Vs)^{-1}$ | $K_{\rm FM} \ = \ $ { 6283 3% } $\ \rm (Vs)^{-1}$ | ||
| Line 62: | Line 62: | ||
</quiz> | </quiz> | ||
| − | === | + | ===Solution=== |
{{ML-Kopf}} | {{ML-Kopf}} | ||
'''(1)''' Richtig ist die <u>Antwort 2</u>: | '''(1)''' Richtig ist die <u>Antwort 2</u>: | ||
Revision as of 13:03, 17 March 2022
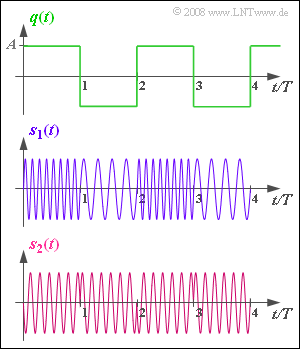
Assume a bipolar and rectangular source signal $q(t)$ , as shown in the upper diagram. This signal can only take on the two signal values $±A = ±2 \ \rm V$ and the duration of the positive and negative rectangles are each $T = 1 \ \rm ms$. The period of $q(t)$ is therefore $T_0 = 2 \ \rm ms$.
The signals $s_1(t)$ and $s_2(t)$ display two transmit signals with angle modulation $\rm (WM)$, each of which can be represented as
- $$s(t) = A_{\rm T} \cdot \cos \hspace{-0.05cm}\big [\psi (t) \big ]$$
Here, we distinguish between phase modulation $\rm (PM)$ with the angular function
- $$\psi(t) = \omega_{\rm T} \cdot t + \phi(t) = \omega_{\rm T} \cdot t + K_{\rm PM} \cdot q(t)$$
and frequency modulation $\rm (FM)$, where the instantaneous freqiency is linearly related to $q(t)$:
- $$f_{\rm A}(t) = \frac{\omega_{\rm A}(t)}{2\pi}, \hspace{0.3cm} \omega_{\rm A}(t) = \frac{{\rm d}\hspace{0.03cm}\psi(t)}{{\rm d}t}= \omega_{\rm T} + K_{\rm FM} \cdot q(t)\hspace{0.05cm}.$$
$K_{\rm PM}$ and $K_{\rm FM}$ denote the dimensionally constrained constants given by the realizations of the PM and FM modulators, respectively. The frequency deviation $Δf_{\rm A}$ indicates the maximum deviation of the instantaneous frequency from the carrier frequency.
Hints:
- This exercise belongs to the chapter Frequency Modulation.
- Reference is also made to the chapter Phase Modulation.
- In anticipation of the fourth chapter, it should be mentioned that phase modulation with a digital input signal is also called Phase Shift Keying $\rm (PSK)$ and frequency modulation is analogously
called Frequency Shift Keying $\rm (FSK)$ .
Questions
Solution
- Bei einem rechteckförmigen (digitalen) Quellensignal erkennt man die Phasenmodulation (PM) an den typischen Phasensprüngen – siehe Signalverlauf $s_2(t)$.
- Die Frequenzmodulation (FM) hat dagegen zu den verschiedenen Zeiten unterschiedliche Augenblicksfrequenzen wie bei $s_1(t)$.
(2) Mit $q(t) = 0$ erhält man entsprechend den gegebenen Gleichungen sowohl für PM als auch für FM
- $$s(t) = A_{\rm T} \cdot \cos (\omega_{\rm T} \cdot t ) \hspace{0.3cm}\Rightarrow\hspace{0.3cm} \phi_{\rm T} \hspace{0.15cm}\underline {= 0}\hspace{0.05cm}.$$
(3) Die Trägerfrequenz $f_{\rm T}$ kann direkt nur aus dem PM–Signal $s_2(t)$ ermittelt werden.
- Durch Abzählen der Schwingungen von $s_2(t)$ im Zeitintervall $T$ erkennt man, dass $f_{\rm T} · T\hspace{0.15cm}\underline{ = 6}$ verwendet wurde.
- Bei der Frequenzmodulation eines bipolaren Quellensignals tritt $f_{\rm T}$ nicht direkt auf.
- Die Grafiken lassen allerdings darauf schließen, dass hier ebenfalls $f_{\rm T} · T = 6$ zugrunde liegt.
(4) Der Amplitudenwert $A = 2 \ \rm V$ führt zur Phase $90^\circ$ bzw. $π/2$ (Minus–Sinusverlauf). Daraus folgt:
- $$K_{\rm PM} = \frac {\pi /2}{2\,{\rm V}} \hspace{0.15cm}\underline {= 0.785\,{\rm V}^{-1}} \hspace{0.05cm}.$$
(5) Die Grafik für $s_1(t)$ zeigt, dass innerhalb eines Zeitintervalls $T$ entweder vier oder acht Schwingungen auftreten: $4 \le f_{\rm A}(t) \cdot T \le 8\hspace{0.05cm}.$
- Unter Berücksichtigung der (normiertern) Trägerfrequenz $f_{\rm T} · T = 6$ ergibt sich für den (normierten) Frequenzhub:
- $$\Delta f_{\rm A} \cdot T \hspace{0.15cm}\underline {=2}\hspace{0.05cm}.$$
(6) Der Frequenzhub kann auch wie folgt dargestellt werden:
- $$\Delta f_{\rm A} = \frac {K_{\rm FM}}{2\pi}\cdot A \hspace{0.05cm}.$$
- Mit $Δf_{\rm A} · {\rm A} = 2$ erhält man somit:
- $$K_{\rm FM} = \frac {2 \cdot 2\pi}{A \cdot T}= \frac {4\pi}{2\,{\rm V} \cdot 1\,{\rm ms}}\hspace{0.15cm}\underline {= 6283 \,{\rm V}^{-1}{\rm s}^{-1}} \hspace{0.05cm}.$$
