Difference between revisions of "Aufgaben:Exercise 2.1Z: DSB-AM without/with Carrier"
m |
m (→Solution) |
||
| Line 68: | Line 68: | ||
===Solution=== | ===Solution=== | ||
{{ML-Kopf}} | {{ML-Kopf}} | ||
| − | '''(1)''' | + | '''(1)''' Both signals are cosine ⇒ $ϕ_{\rm N} \hspace{0.15cm}\underline { = 0}$ and $ϕ_{\rm T} \hspace{0.15cm}\underline { = 0}$. |
| − | '''(2)''' | + | '''(2)''' From the graph, the period durations of $200$ μs and $20$ μs can be seen for $q(t)$ and $z(t)$, respectively. |
| − | * | + | *This gives the frequencies as $f_{\rm N} \hspace{0.15cm}\underline { = 5}$ kHz and $f_{\rm T} \hspace{0.15cm}\underline { = 50}$ kHz. |
| − | '''(3)''' | + | '''(3)''' <u>Answers 1 and 2</u> are correct: |
| − | * | + | *The zero crossings of $z(t)$ at $±5$ μs, $±15$ μs, $±25$ μs, ... ... are also present in the signal $s(t)$ ⇒ Answer 1 is correct. |
| − | * | + | *Other zero intersects of $s(t)$ – cause by $q(t)$ – are present at $±50$ μs, $±150$ μs, $±250$ μs, .... ⇒ Answer 2 is also correct. |
| − | * | + | *In contrast, the third statement is not true. Instead, $ s(t) = a(t) \cdot \cos[\omega_{\rm T} t + \phi (t)] \hspace{0.05cm}.$ |
| − | * | + | *For $q(t) > 0$ the phase function is $ϕ(t) = 0$ and $s(t)$ coincides with $z(t)$. |
| − | * | + | *n contrast, for $q(t) < 0$: $ϕ(t) = π = 180^\circ$. |
| − | * | + | *BAt the zero crossings of $q(t)$ , the modulated signal $s(t)$ exhibits phase jumps. |
| − | [[File:EN_Mod_Z_2_1_d.png|right|frame| | + | [[File:EN_Mod_Z_2_1_d.png|right|frame|DSB–AM Spectrum $Z(f)$, $Q(f)$ and $S(f)$]] |
| − | '''(4)''' | + | '''(4)''' The spectrum $S(f)$ results from the convolution of the spectral functions $Z(f)$ and $Q(f)$, each consisting of only two Dirac functions. The graph displays the result. |
| − | * | + | *The Dirac functions plotted in red apply only to the "DSB-AM with carrier" and refer to subtask ('''6)'''. |
| − | * | + | *Convolution of the two $Z(f)$–Dirac functions at $f_{\rm T} = 50\text{ kHz}$ with $Q(f)$ leads to the Dirac lines at $f_{\rm T} - f_{\rm N}$ and $f_{\rm T} + f_{\rm N}$, each with weight $0.5 · 0.5\text{ V}= 0.25\text{ V}$. |
| − | * | + | *Thus, the desired values are $f_1\hspace{0.15cm}\underline { = 45 \ \rm kHz}$ and $f_1\hspace{0.15cm}\underline { = 55 \ \rm kHz}$. |
| − | * | + | *The Dirac function $0.5 · δ(f + f_{\rm T})$ with two markers leads to two more Dirac lines at $-f_1$ and $-f_2$. |
| − | '''(5)''' | + | '''(5)''' The modulation depth is calculated as: |
:$$ m = \frac{q_{\rm max}}{A_{\rm T}} = \frac{A_{\rm N}}{A_{\rm T}} \hspace{0.15cm}\underline {= 0.5} \hspace{0.05cm}.$$ | :$$ m = \frac{q_{\rm max}}{A_{\rm T}} = \frac{A_{\rm N}}{A_{\rm T}} \hspace{0.15cm}\underline {= 0.5} \hspace{0.05cm}.$$ | ||
| − | '''(6)''' | + | '''(6)''' <u>Answers 1 and 3</u> are correct: |
| − | * | + | *According to the sketch, Dirac lines result at $±f_{\rm T}$, both with impulse weight $A_{\rm T}/2 = 1\text{ V}$. |
| − | * | + | *At $m ≤ 1$ , $q(t)$ is detectable in the envelope and envelope demodulation is applicable. |
| − | * | + | *However, this simpler receiver variant must be accounted for with a much larger transmission power. |
| − | *In | + | *In this example $(m = 0.5)$ the addition of a carrier multiplies the transmission power by nine. |
{{ML-Fuß}} | {{ML-Fuß}} | ||
Revision as of 12:24, 24 November 2021
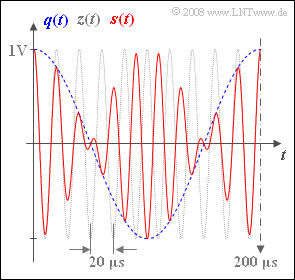
The red curve on the graph shows a section of the transmitted signal $s(t) = q(t) · z(t)$ of a double-sideband amplitude modulation (abbreviated as DSB-AM) without carrier. (abgekürzt mit ZSB-AM) ohne Träger. The duration of the time interval is $\rm 200 \ µ s$.
Additionally plotted in the graph are:
- the source signal (as a blue dashed curve):
- $$q(t) = 1\,{\rm V} \cdot \cos(2 \pi f_{\rm N} t + \phi_{\rm N}),$$
- the carrier signal (as a grey dashed trace):
- $$z(t) = 1 \cdot \cos(2 \pi f_{\rm T} t + \phi_{\rm T})$$
From subtask (4) onwards, the "DSB-AM with carrier" is considered. In that case, with $A_{\rm T} = 2\text{ V}$:
- $$s(t) = \left(q(t) + A_{\rm T} \right) \cdot z(t) \hspace{0.05cm}.$$
Hints:
- This exercise belongs to the chapter Double-Sideband Amplitude Modulation.
- Particlar reference is made to the pages Description in the time domain and Double-Sideband Amplitude Modulation with carrier.
Fragebogen
Solution
(2) From the graph, the period durations of $200$ μs and $20$ μs can be seen for $q(t)$ and $z(t)$, respectively.
- This gives the frequencies as $f_{\rm N} \hspace{0.15cm}\underline { = 5}$ kHz and $f_{\rm T} \hspace{0.15cm}\underline { = 50}$ kHz.
(3) Answers 1 and 2 are correct:
- The zero crossings of $z(t)$ at $±5$ μs, $±15$ μs, $±25$ μs, ... ... are also present in the signal $s(t)$ ⇒ Answer 1 is correct.
- Other zero intersects of $s(t)$ – cause by $q(t)$ – are present at $±50$ μs, $±150$ μs, $±250$ μs, .... ⇒ Answer 2 is also correct.
- In contrast, the third statement is not true. Instead, $ s(t) = a(t) \cdot \cos[\omega_{\rm T} t + \phi (t)] \hspace{0.05cm}.$
- For $q(t) > 0$ the phase function is $ϕ(t) = 0$ and $s(t)$ coincides with $z(t)$.
- n contrast, for $q(t) < 0$: $ϕ(t) = π = 180^\circ$.
- BAt the zero crossings of $q(t)$ , the modulated signal $s(t)$ exhibits phase jumps.
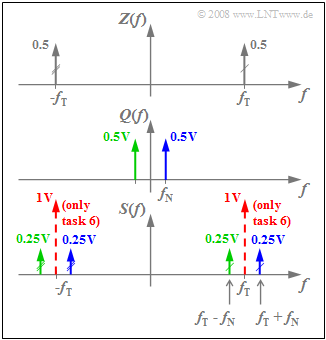
(4) The spectrum $S(f)$ results from the convolution of the spectral functions $Z(f)$ and $Q(f)$, each consisting of only two Dirac functions. The graph displays the result.
- The Dirac functions plotted in red apply only to the "DSB-AM with carrier" and refer to subtask (6).
- Convolution of the two $Z(f)$–Dirac functions at $f_{\rm T} = 50\text{ kHz}$ with $Q(f)$ leads to the Dirac lines at $f_{\rm T} - f_{\rm N}$ and $f_{\rm T} + f_{\rm N}$, each with weight $0.5 · 0.5\text{ V}= 0.25\text{ V}$.
- Thus, the desired values are $f_1\hspace{0.15cm}\underline { = 45 \ \rm kHz}$ and $f_1\hspace{0.15cm}\underline { = 55 \ \rm kHz}$.
- The Dirac function $0.5 · δ(f + f_{\rm T})$ with two markers leads to two more Dirac lines at $-f_1$ and $-f_2$.
(5) The modulation depth is calculated as:
- $$ m = \frac{q_{\rm max}}{A_{\rm T}} = \frac{A_{\rm N}}{A_{\rm T}} \hspace{0.15cm}\underline {= 0.5} \hspace{0.05cm}.$$
(6) Answers 1 and 3 are correct:
- According to the sketch, Dirac lines result at $±f_{\rm T}$, both with impulse weight $A_{\rm T}/2 = 1\text{ V}$.
- At $m ≤ 1$ , $q(t)$ is detectable in the envelope and envelope demodulation is applicable.
- However, this simpler receiver variant must be accounted for with a much larger transmission power.
- In this example $(m = 0.5)$ the addition of a carrier multiplies the transmission power by nine.

