Contents
- 1 Generalized system functions of time variant systems
- 2 Simplifications due to the GWSSUS requirements
- 3 Autocorrelation function of the time variant impulse response
- 4 Leistungsdichtespektrum der zeitvarianten Impulsantwort
- 5 AKF und LDS der frequenzvarianten Übertragungsfunktion
- 6 AKF und LDS der Verzögerungs–Doppler–Funktion
- 7 AKF und LDS der zeitvarianten Übertragungsfunktion
- 8 Kenngrößen des GWSSUS–Modells
- 9 Simulation gemäß dem GWSSUS–Modell
- 10 Aufgaben zum Kapitel
- 11 Quellenverzeichnis
Generalized system functions of time variant systems
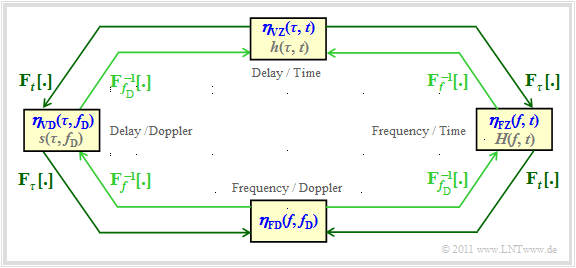
While linear time-invariant systems $\rm (LTI)$ with the transfer function $H(f)$ and the impulse response $h(t)$ – after renaming $h(\tau)$ – there are only two system functions that completely describe the system, four different functions are possible with time-variant systems $\rm (LTV)$ . A formal differentiation of these functions with regard to time and frequency domain representation by a lowercase and uppercase letters is thus excluded.
We are therefore now making a nomenclature change, which can be formalised as follows:
- The four possible system functions are uniformly denoted by $\bold symbol{\eta}_{12}$ .
- The first index is either a $\bold symbol{\rm V}$ $($delay time $\tau)$ or a $\bold symbol{\rm F}$ $($frequency $f)$.
- Either a $\bold symbol{\rm Z}$ $($Time $t)$ or a $\bold symbol{\rm D}$ $($Doppler frequency $f_{\rm D})$ is possible as the second index.
Since, in contrast to line-based transmission, the system functions of mobile communications cannot be described deterministically, but are statistical variables, the corresponding correlation functions must be considered later on;
In the following, we will refer to these as $\boldsymbol{\varphi}_{12}$, and use the same indices as for the system functions $\boldsymbol{\eta}_{12}$.
These formalized designations are inscribed in the graphic in blue letters.
- Additionally, the designations used in other chapters or literature are given (grey letters).
- In the other chapters these are also partly used.
- At the top you can see the time variant impulse response ${\eta}_{\rm VZ}(\tau,\hspace{0.05cm} t) \equiv h(\tau,\hspace{0.05cm} t)$ in the delay–time range. The associated autocorrelation function (ACF) is
- \[\varphi_{\rm VZ}(\tau_1, t_1, \tau_2, t_2) = {\rm E} \big [ \eta_{\rm VZ}(\dew_1,\hspace{0.05cm} t_1) \cdot \eta_{\rm VZ}^{\star}(\tau_2, t_2) \big ]\hspace{0.05cm}. \]
- To frequency–time representation you get the time-variant transfer function ${\eta}_{\rm FZ}(f,\hspace{0. 05cm} t) \equiv H(f,\hspace{0.05cm} t)$. The Fourier transform with respect to $\tau$ is represented in the graph by ${\rm F}_\tau\hspace{0.05cm}[ \cdot ]$ indicated. The Fourier integral is written out in full:
- \[\eta_{\rm FZ}(f, \hspace{0.05cm} t) = \int_{-\infty}^{+\infty} \eta_{\rm VZ}(\tau,\hspace{0.05cm} t) \cdot {\rm e}^{- {\rm j}\cdot 2 \pi f \tau}\hspace{0.15cm}{\rm d}\tau \hspace{0.05cm}, \hspace{0.3cm} \text{kurz:} \hspace{0.2cm} \eta_{\rm FZ}(f, t) \hspace{0.2cm} \stackrel{f, \hspace{0.05cm} \tau}{\bullet\!\!-\!\!\!-\!\!\!-\!\!\circ} \hspace{0.2cm} \eta_{\rm VZ}(\tau, t) \hspace{0.05cm}.\]
The ACF of this time variant transfer function is general:
- \[\varphi_{\rm FZ}(f_1, t_1, f_2, t_2) = {\rm E} \big [ \eta_{\rm FZ}(f_1, t_1) \cdot \eta_{\rm FZ}^{\star}(f_2, t_2) \big ]\hspace{0.05cm}.\]
- The Scatter–Function ${\eta}_{\rm VD}(\tau,\hspace{0.05cm} f_{\rm D}) \equiv s(\tau,\hspace{0.05cm} f_{\rm D})$ corresponding to the left block describes the mobile communications channel in the Delay–Doppler Area. The function parameter $f_{\rm D}$ describes the Doppler_frequency. The scatter function results from the time variant impulse response ${\eta}_{\rm VZ}(\tau,\hspace{0.05cm} t)$ through Fourier transformation with respect to the second parameter $t$:
- \[ \eta_{\rm VD}(\tau, f_{\rm D}) \hspace{0.2cm} \stackrel{f_{\rm D}, \hspace{0.05cm}t}{\bullet\!\!-\!\!\!-\!\!\!-\!\!\circ} \hspace{0.2cm} \eta_{\rm VZ}(\tau, t)\hspace{0.3cm} \Rightarrow \hspace{0.3cm} \varphi_{\rm VD}(\tau_1, f_{\rm D_1}, \tau_2, f_{\rm D_2}) = {\rm E} \left [ \eta_{\rm VD}(\tau_1, f_{\rm D_1}) \cdot \eta_{\rm VD}^{\star}(\tau_2, f_{\rm D_2}) \right ] \hspace{0.05cm}.\]
- Finally, we consider the so-called 'frequency-variant transfer function, i.e. the frequency–Doppler representation. According to the graph, this can be reached in two ways:
- \[\eta_{\rm FD}(f, f_{\rm D}) \hspace{0.2cm} \stackrel{f_{\rm D}, \hspace{0.05cm}t}{\bullet\!\!-\!\!\!-\!\!\!-\!\!\circ} \hspace{0.2cm} \eta_{\rm FZ}(f, t)\hspace{0.05cm},\]
- \[\eta_{\rm FD}(f, f_{\rm D}) \hspace{0.2cm} \stackrel{f, \hspace{0.05cm}\tau}{\bullet\!\!-\!\!\!-\!\!\!-\!\!\circ} \hspace{0.2cm} \eta_{\rm VD}(\tau, f_{\rm D})\hspace{0.05cm}.\]
$\text{Hints:}$
- The specified Fourier correlations between the system functions in the graph are illustrated by the outer, dark green arrows and are marked with ${\rm F}_p\hspace{0.05cm}[\hspace{0. 05cm} \cdot \hspace{0.05cm}]$ denoted $p$ indicates to which parameter $\tau$, $f$, $t$ or $f_{\rm D}$ refers to the Fourier transformation.
- The inner (lighter) arrows indicate the links via the [[[Signal_Representation/Fouriertransformation_und_-r%C3%BCcktransformation#Das_zweite_Fourierintegral|inverse Fourier transform]] (inverse Fourier transform). For this we use the notation ${ {\rm F}_p}^{-1}\hspace{0.05cm}[ \hspace{0.05cm} \cdot \hspace{0.05cm} ]$.
- The applet Impulses and Spectra illustrates the connection between the time's and frequency's domain, which can be described by formulas using Fourier transformation and Fourier inverse transformation.
Simplifications due to the GWSSUS requirements
The general relationship between the four system functions is very complicated due to non-stationary effects.
Compared to the general model, some limitations have to be made in order to arrive at a suitable model for the mobile communications channel from which relevant statements for practical applications can be derived.
.
The following definitions lead to the $\rm GWSSUS$ model
$( \rm G$aussian $\rm W$ide $\rm S$ense $\rm S$tationary $\rm U$ncorrelated $\rm S$cattering$)$:
- The random process of the channel impulse response $h(\tau,\hspace{0.1cm} t) = {\eta}_{\rm VZ}(\tau,\hspace{0. 1cm} t)$ is generally assumed to be complex (i.e., description in the equivalent low-pass range), Gaussian $($identifier $\rm G)$ and zero-mean (Rayleigh, not Rice, that means, no line of sight) .
- The random process is weakly stationary ⇒ its characteristics change only slightly with time, and the ACF $ {\varphi}_{\rm VZ}(\tau_1,\hspace{0.05cm} t_1,\hspace{0.05cm}\tau_2,\hspace{0. 05cm} t_2)$ of the time variant impulse response does not depend on the absolute times $t_1$ and $t_2$ but only on the time difference $\Delta t = t_2 - t_1$. This is indicated by the identifier $\rm WSS$ ⇒ $\rm W$ide $\rm S$ense $\rm S$tationary.
- The individual echoes due to multipath propagation are uncorrelated, which is expressed by the identifier $\rm US$ ⇒ $\rm U$ncorrelated $\rm S$cattering.
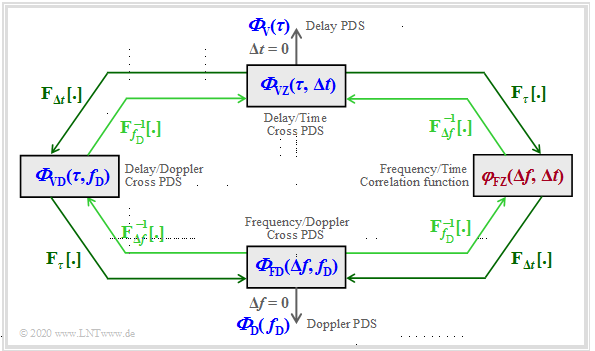
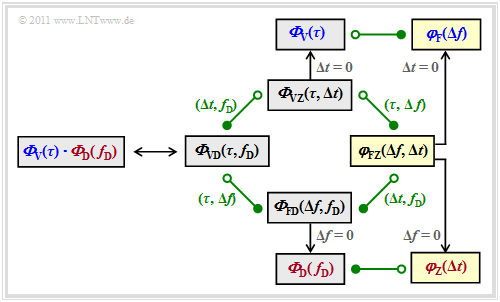
The mobile communications channel can be described in full according to this graph. The individual power density spectra (labeled blue) and the correlation function (labeled red) is explained in detail in the following pages.
Autocorrelation function of the time variant impulse response
We now consider the Autocorrelation Function $\rm (ACF)$ of the time variant impulse response ⇒ $h(\tau,\hspace{0. 1cm} t) = {\eta}_{\rm VZ}(\tau,\hspace{0.1cm} t)$ more closely. It shows
- Based on the $\rm WSS$ property, the autocorrelation function can be written with $\Delta t = t_2 - t_1$ :
- \[\varphi_{\rm VZ}(\tau_1, t_1, \tau_2, t_2) = \varphi_{\rm VZ}(\tau_1, \tau_2, \Delta t)\hspace{0.05cm}.\]
- Since the echoes were assumed to be independent of each other $\rm (US$ property$)$, the impulse response can be assumed to be uncorrelated with respect to the delays $\tau_1$ and $\tau_2$ Then:
- \[\varphi_{\rm VZ}(\tau_1, \tau_2, \Delta t) = 0 \hspace{0.35cm}{\rm f\ddot{u}r}\hspace{0.35cm} \tau_1 \ne \tau_2\hspace{0.05cm}. \]
- If one now replaces $\tau_1$ with $\tau$ and $\tau_2$ with $\tau + \delta \tau$, this autocorrelation function can be represented in the following way:
- \[\varphi_{\rm VZ}(\Delta \tau, \Delta t) = \delta(\Delta \tau) \cdot {\it \Phi}_{\rm VZ}(\tau, \Delta t) \hspace{0.05cm}. \]
- Because of the convolution property of the Dirac function, the ACF for $\tau_1 \ne \tau_2$ ⇒ $\delta \tau \ne 0$ disappears.
- $ {\it \Phi}_{\rm VZ}(\tau, \Delta t) \hspace{0.1cm}$ is the delay–time–cross power density spectrum, which depends on the delay $\tau \ (= \tau_1 =\tau_2)$ and on the time difference $\delta t = t_2 - t_1$ .
$\text{Please note:}$ 
- With this approach, autocorrelation function $\varphi_{\rm VZ}(\Delta \tau, \Delta t)$ and power density spectrum ${\it \Phi}_{\rm VZ}(\tau, \Delta t) $ are not connected via the Fourier transform as usual, but are linked via a Dirac function:
- \[\varphi_{\rm VZ}(\Delta \tau, \Delta t) = \delta(\Delta \tau) \cdot {\it \Phi}_{\rm VZ}(\tau, \Delta t) \hspace{0.05cm}. \]
- Not all symmetry properties that follow from the Wiener–Chintchine–Theorem are thus also given here. In particular it is quite possible and even very likely that such a power density spectrum is an odd function.
In the overview on the last page, the Delay–Time Cross power density spectrum' ${\it \Phi}_{\rm VZ}(\tau, \delta t) $ can be seen in the top middle.
- Since $\eta_{\rm VZ}(\tau, t) $ like any Impulse Response the unit $\rm [1/s]$ has, the autocorrelation function has the unit $\rm [1/s^2]$:
- \[\varphi_{\rm VZ}(\Delta \tau, \Delta t) = {\rm E} \left [ \eta_{\rm VZ}(\tau, t) \cdot \eta_{\rm VZ}^{\star}(\tau + \Delta \tau, t + \Delta t) \right ].\]
- Da aber auch die Diracfunktion mit Zeitargument, also $\delta(\Delta \tau)$, die Einheit $\rm [1/s]$ hat, besitzt das Verzögerungs–Zeit–Kreuzleistungsdichtespektrum ${\it \Phi}_{\rm VZ}(\tau, \Delta t) $ ebenfalls die Einheit $\rm [1/s]$:
- \[\varphi_{\rm VZ}(\Delta \tau, \Delta t) = \delta(\Delta \tau) \cdot {\it \Phi}_{\rm VZ}(\tau, \Delta t) \hspace{0.05cm}.\]
Leistungsdichtespektrum der zeitvarianten Impulsantwort
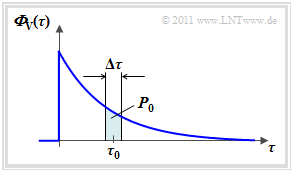
Zum Verzögerungs–Leistungsdichtespektrum ${\it \Phi}_{\rm V}(\Delta \tau)$ kommt man, indem man in der Funktion ${\it \Phi}_{\rm VZ}(\Delta \tau, \Delta t)$ den zweiten Parameter $\Delta t = 0$ setzt. Die Grafik rechts zeigt einen beispielhaften Verlauf.
Das Verzögerungs–Leistungsdichtespektrum ist eine zentrale Größe für die Beschreibung des Mobilfunkkanals. Diese weist folgende Eigenschaften auf:
- ${\it \Phi}_{\rm V}(\Delta \tau_0)$ ist ein Maß für die „Leistung” derjenigen Signalanteile, die um $\tau_0$ verzögert werden. Es wird hierfür implizit eine Mittelung über alle Dopplerfrequenzen $(f_{\rm D})$ vorgenommen.
- Das Verzögerungs–Leistungsdichtespektrum ${\it \Phi}_{\rm V}(\Delta \tau)$ hat wie ${\it \Phi}_{\rm VZ}(\Delta \tau, \Delta t)$ die Einheit $\rm [1/s]$. Es charakterisiert die Leistungsverteilung über alle möglichen Verzögerungszeiten $\tau$.
- In obiger Grafik farblich markiert ist die Leistung $ P_0 \approx {\it \Phi}_{\rm V}(\Delta \tau_0)\cdot \Delta \tau$ solcher Signalanteile, die beim Empfänger über beliebige Pfade mit einer Verzögerung zwischen $\tau_0 \pm \Delta \tau/2$ eintreffen.
- Normiert man das Leistungsdichtespektrum ${\it \Phi}_{\rm V}(\Delta \tau)$ derart, dass sich die Fläche $1$ ergibt, so erhält man die Wahrscheinlichkeitsdichtefunktion $\rm (WDF)$ der Verzögerungszeit:
- \[{\rm WDF}_{\rm V}(\tau) = \frac{{\it \Phi}_{\rm V}(\tau)}{\int_{0 }^{\infty}{\it \Phi}_{\rm V}(\tau)\hspace{0.15cm}{\rm d}\tau} \hspace{0.05cm}.\]
Anmerkung zur Nomenklatur:
- Im Buch „Stochastische Signaltheorie” hätten wir diese Wahrscheinlichkeitsdichtefunktion mit $f_\tau(\tau)$ bezeichnet.
- Um den Zusammenhang zwischen ${\it \Phi}_{\rm V}(\Delta \tau)$ und der WDF deutlich werden zu lassen und Verwechslungen mit der Frequenz $f$ zu vermeiden, verwenden wir die hier angegebene Nomenklatur.
$\text{Beispiel 1: Verzögerungsmodelle nach COST 207}$
In den 1990er Jahren gründete die Europäische Union die Arbeitsgruppe COST 207 mit dem Ziel, standardisierte Kanalmodelle für den zellularen Mobilfunk bereitzustellen. Hierbei steht „COST” für European Cooperation in Science and Technology.
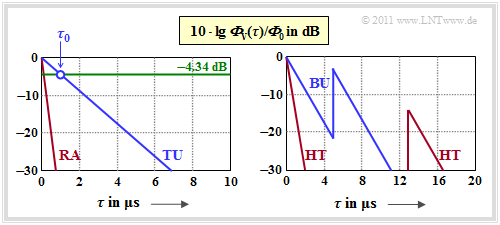
In diesem internationalen Gremium wurden Profile für die Verzögerungszeit $\tau$ entwickelt, basierend auf Messungen und gültig für verschiedene Anwendungsszenarien. Im Folgenden werden vier verschiedene Verzögerungs–Leistungsdichtespektren angegeben, wobei stets der Normierungsfaktor ${\it \Phi}_0 = {\it \Phi}_{\rm V}(\tau = 0)$ verwendet wird. Die Grafik zeigt die Verzögerungs–Leistungsdichte dieser Profile in logarithmischer Darstellung:
(1) Profil $\rm RA$ (englisch Rural Area) ⇒ ländliches Gebiet:
- \[{\it \Phi}_{\rm V}(\tau)/{\it \Phi}_{\rm 0} = {\rm e}^{ -\tau / \tau_0} \hspace{0.3cm}{\rm im \hspace{0.15cm}Bereich}\hspace{0.3cm} 0 < \tau < 0.7\,{\rm µ s}\hspace{0.05cm},\hspace{0.15cm}\tau_0 = 0.109\,{\rm µ s}\hspace{0.05cm}.\]
(2) Profil $\rm TU$ (englisch Typical Urban) ⇒ Städte und Vororte:
- \[{\it \Phi}_{\rm V}(\tau)/{\it \Phi}_{\rm 0} = {\rm e}^{ -\tau / \tau_0} \hspace{0.3cm}{\rm im \hspace{0.15cm}Bereich}\hspace{0.3cm} 0 < \tau < 7\,{\rm µ s}\hspace{0.05cm},\hspace{0.15cm}\tau_0 = 1\,{\rm µ s}\hspace{0.05cm}.\]
(3) Profil $\rm BU$ (englisch Bad Urban) ⇒ ungünstige Bedingungen in Städten:
- \[{\it \Phi}_{\rm V}(\tau)/{\it \Phi}_{\rm 0} = \left\{ \begin{array}{c} {\rm e}^{ -\tau / \tau_0}\\ 0.5 \cdot {\rm e}^{ (5\,{\rm µ s}-\tau) / \tau_0} \end{array} \right.\quad \begin{array}{*{1}l} \hspace{0.1cm} {\rm für}\hspace{0.3cm} 0 < \tau < 5\,{\rm µ s}\hspace{0.05cm},\hspace{0.15cm}\tau_0 = 1\,{\rm µ s}\hspace{0.05cm}, \\ \hspace{0.1cm} {\rm für}\hspace{0.3cm} 5\,{\rm µ s} < \tau < 10\,{\rm µ s}\hspace{0.05cm},\hspace{0.15cm}\tau_0 = 1\,{\rm µ s} \hspace{0.05cm}. \\ \end{array}\]
(4) Profil $\rm HT$ (englisch Hilly Terrain) ⇒ hügeliges Gebiet und Bergland:
- \[{\it \Phi}_{\rm V}(\tau)/{\it \Phi}_{\rm 0} = \left\{ \begin{array}{c} {\rm e}^{ -\tau / \tau_0}\\ 0.04 \cdot {\rm e}^{ (15\,{\rm µ s}-\tau) / \tau_0} \end{array} \right.\quad \begin{array}{*{1}l} \hspace{-0.25cm} {\rm für}\hspace{0.3cm} 0 < \tau < 2\,{\rm µ s}\hspace{0.05cm},\hspace{0.15cm}\tau_0 = 0.286\,{\rm µ s}\hspace{0.05cm}, \\ \hspace{-0.25cm} {\rm für}\hspace{0.3cm} 15\,{\rm µ s} < \tau < 20\,{\rm µ s}\hspace{0.05cm},\hspace{0.15cm}\tau_0 = 1\,{\rm µ s} \hspace{0.05cm}. \\ \end{array}\]
Man erkennt aus den Grafiken:
- Aus den Exponentialfunktionen bei linearer Darstellung werden nun geradlinige Verläufe.
- Bei logarithmischer Darstellung kann man den LDS–Parameter $\tau_0$ bei $\rm 10 \cdot lg \ (1/e) = -4.34 \ dB$ ablesen, wie in der Grafik für das $\rm TU$-Profil eingezeichnet.
- Auf diese vier COST–Profile wird in der Aufgabe 2.8 noch genauer eingegangen.
AKF und LDS der frequenzvarianten Übertragungsfunktion
Die in der Übersicht auf der ersten Seite dieses Kapitels unten dargestellte Systemfunktion $\eta_{\rm FD}(f, f_{\rm D})$ wird auch frequenzvariante Übertragungsfunktion genannt, wobei sich das Adjektiv „frequenzvariant” auf die Dopplerfrequenz bezieht.
Die dazugehörige AKF ist wie folgt definiert:
- \[\varphi_{\rm FD}(f_1, f_{\rm D_1}, f_2, f_{\rm D_2}) = {\rm E} \left [ \eta_{\rm FD}(f_1, f_{\rm D_1}) \cdot \eta_{\rm FZ}^{\star}(f_2, f_{\rm D_2}) \right ]\hspace{0.05cm}. \]
Durch ähnliche Überlegungen wie auf der vorletzten Seite kann man diese Autokorrelationsfunktion unter GWSSUS–Bedingungen wie folgt darstellen:
- \[\varphi_{\rm FD}(\Delta f, \Delta f_{\rm D}) = \delta(\Delta f_{\rm D}) \cdot {\it \Phi}_{\rm FD}(\Delta f, f_{\rm D}) \hspace{0.05cm}.\]
Dabei gilt:
- ${\it \Phi}_{\rm FD}(\Delta f, f_{\rm D})$ ist das so genannte Frequenz–Doppler–Kreuzleistungsdichtespektrum, das in der Grafik am Seitenende durch gelbe Hinterlegung hervorgehoben ist.
- Das erste Argument $\Delta f = f_2 - f_1$ berücksichtigt, dass AKF und LDS aufgrund der Stationarität nur von der Frequenzdifferenz abhängen.
- Der Faktor $\delta (\Delta f_{\rm D})$ mit $\Delta f_{\rm D} = f_{\rm D_2} - f_{\rm D_1}$ drückt die Unkorreliertheit der AKF bezüglich der Dopplerverschiebung aus.
- Man kommt von ${\it \Phi}_{\rm FD}(\Delta f, f_{\rm D})$ zum Doppler–Leistungsdichtespektrum ${\it \Phi}_{\rm D}(f_{\rm D})$, wenn man $\Delta f= 0$ setzt.
- Das Doppler–Leistungsdichtespektrum ${\it \Phi}_{\rm D}(f_{\rm D})$ gibt an, mit welcher Leistung einzelne Dopplerfrequenzen auftreten.
- Die Wahrscheinlichkeitsdichte der Dopplerfrequenz ergibt sich aus ${\it \Phi}_{\rm D}(f_{\rm D})$ durch geeignete Flächennormierung. Die WDF weist wie ${\it \Phi}_{\rm D}(f_{\rm D})$ die Einheit $\rm [1/Hz]$ auf:
- \[{\rm WDF}_{\rm D}(f_{\rm D}) = \frac{{\it \Phi}_{\rm D}(f_{\rm D})}{\int_{-\infty }^{+\infty}{\it \Phi}_{\rm D}(f_{\rm D})\hspace{0.15cm}{\rm d}f_{\rm D}} \hspace{0.05cm}.\]
- Oft, so zum Beispiel für eine vertikale Monopulsantenne im isotrop gestreuten Feld, ist ${\it \Phi}_{\rm D}(f_{\rm D})$ durch das Jakes–Spektrum gegeben.
Das Frequenz–Doppler–Kreuzleistungsdichtespektrum ${\it \Phi}_{\rm FD}(\Delta f, f_{\rm D})$ ist gelb hinterlegt.
- Eingezeichnet sind auch die Fourierzusammenhänge zu den benachbarten GWSSUS–Systembeschreibungsfunktionen.
- Wir verweisen hier auf das interaktive Applet Zur Verdeutlichung des Dopplereffekts.
AKF und LDS der Verzögerungs–Doppler–Funktion
Die in der Übersicht auf der ersten Seite dieses Kapitels links dargestellte Systemfunktion wurde mit $\eta_{\rm VD}(\tau, f_{\rm D})$ bezeichnet. Die AKF dieser Verzögerungs–Doppler–Funktion kann unter Berücksichtigung der GWSSUS–Eigenschaften mit $\Delta \tau = \tau_2 - \tau_1$ und $\Delta f_{\rm D} = f_{\rm D2} - f_{\rm D1}$ wie folgt geschrieben werden:
- \[\varphi_{\rm VD}(\tau_1, f_{\rm D_1}, \tau_2, f_{\rm D_2}) = \varphi_{\rm VD}(\Delta \tau, \Delta f_{\rm D}) = \delta(\Delta \tau) \cdot {\rm \delta}(\Delta f_{\rm D}) \cdot {\it \Phi}_{\rm VD}(\tau, f_{\rm D}) \hspace{0.05cm}.\]
Zu dieser Gleichung ist anzumerken:
- Die erste Diracfunktion $\delta (\Delta \tau)$ berücksichtigt, dass die Verzögerungen unkorreliert sind („Uncorrelated Scattering”).
- Die zweite Diracfunktion $\delta (\Delta f_{\rm D})$ folgt aus der Stationarität („Wide Sense Stationary”).
- Das Verzögerungs–Doppler–Leistungsdichtespektrum ${\it \Phi}_{\rm VD}(\tau, f_{\rm D})$ – auch Scatter–LDS genannt – kann aus ${\it \Phi}_{\rm VZ}(\tau, \Delta t)$ bzw. ${\it \Phi}_{\rm FD}(\Delta f, f_{\rm D})$ berechnet werden:
- \[{\it \Phi}_{\rm VD}(\tau, f_{\rm D}) ={\rm F}_{\Delta t} \big [ {\it \Phi}_{\rm VZ}(\tau, \Delta t) \big ] = \int_{-\infty}^{+\infty} {\it \Phi}_{\rm VZ}(\tau, \Delta t) \cdot {\rm e}^{- {\rm j}\hspace{0.05cm}\cdot \hspace{0.05cm}2 \pi \hspace{0.05cm}\cdot \hspace{0.05cm}f_{\rm D} \hspace{0.05cm}\cdot \hspace{0.05cm}\Delta t}\hspace{0.15cm}{\rm d}\Delta t \hspace{0.05cm},\]
- \[{\it \Phi}_{\rm VD}(\tau, f_{\rm D}) = {\rm F}_{f_{\rm D}}^{-1} \big [ {\it \Phi}_{\rm FD}(\Delta f, f_{\rm D}) \big ] = \int_{-\infty}^{+\infty} {\it \Phi}_{\rm FD}(\Delta f, f_{\rm D}) \cdot {\rm e}^{+{\rm j}\hspace{0.05cm}\cdot \hspace{0.05cm} 2 \pi \hspace{0.05cm}\cdot \hspace{0.05cm} \tau \hspace{0.05cm}\cdot \hspace{0.05cm} \Delta f}\hspace{0.15cm}{\rm d}\Delta f \hspace{0.05cm}. \]
- Sowohl die Systemfunktion $\eta_{\rm VD}(\tau, f_{\rm D})$ als auch die abgeleiteten Funktionen $\varphi _{\rm VD}(\Delta \tau, \Delta f_{\rm D})$ und ${\it \Phi}_{\rm VD}(\tau, f_{\rm D})$ sind dimensionslos. Nähere Angaben hierüber finden Sie in der Angabe zu Aufgabe 2.6.
- Weiterhin ist bei Erfüllung der GWSSUS–Voraussetzungen die Scatterfunktion gleich dem Produkt aus Verzögerungs– und Doppler–Leistungsdichtespektrum:
- \[{\it \Phi}_{\rm VD}(\tau, f_{\rm D}) = {\it \Phi}_{\rm V}(\tau) \cdot {\it \Phi}_{\rm D}(f_{\rm D})\hspace{0.05cm}.\]
$\text{Fazit:}$ Die Abbildung fasst die bisherigen Ergebnisse dieses Kapitels zusammen.
Festzuhalten ist:
(1) Der Einfluss der Verzögerungszeit (Laufzeit) $\tau$ und der Dopplerfrequenz $f_{\rm D}$ lässt sich separieren
- in das blaue Leistungsdichtespektrum ${\it \Phi}_{\rm V}(\tau)$, und
- das rote Leistungsdichtespektrum ${\it \Phi}_{\rm D}(f_{\rm D})$.
(2) Das 2D–Verzögerungs–Doppler–Leistungsdichtespektrum ${\it \Phi}_{\rm VD}(\tau, f_{\rm D})$ ist gleich dem Produkt aus diesen beiden Anteilen.
AKF und LDS der zeitvarianten Übertragungsfunktion
Die folgende Grafik zeigt alle Zusammenhänge zwischen den einzelnen Leistungsdichtespektren nochmals in kompakter Form.
Auf den letzten Seiten wurden dabei bereits behandelt:
- $${\it \Phi}_{\rm VZ}(\tau, \Delta t)\hspace{0.55cm}\Rightarrow \hspace{0.3cm}\text{mit} \hspace{0.2cm}\Delta t = 0\text{:} \hspace{0.2cm} {\it \Phi}_{\rm V}(\tau),$$
- $${\it \Phi}_{\rm FD}(\Delta f, f_{\rm D})\hspace{0.3cm}\Rightarrow \hspace{0.3cm}\text{mit} \hspace{0.2cm}\Delta f = 0\text{:} \hspace{0.2cm} {\it \Phi}_{\rm D}( f_{\rm D}),$$
- $${\it \Phi}_{\rm VD}(\tau, f_{\rm D})= {\it \Phi}_{\rm V}(\tau) \cdot {\it \Phi}_{\rm D}(f_{\rm D})\hspace{0.05cm}.$$
Bisher noch nicht betrachtet wurde die Frequenz–Zeit–Korrelationsfunktion
(in nebenstehender Grafik gelb markiert):
- \[\varphi_{\rm FZ}(f_1, t_1, f_2, t_2) = {\rm E} \left [ \eta_{\rm FZ}(f_1, t_1) \cdot \eta_{\rm FZ}^{\star}(f_2, t_2) \right ]\hspace{0.05cm}.\]
Berücksichtigt man wieder die GWSSUS–Vereinfachungen sowie die Identität $\eta_{\rm FZ}(f, \hspace{0.05cm}t) = H(f, \hspace{0.05cm}t)$, so lässt sich die AKF mit $\Delta f = f_2 - f_1$ und $\Delta t = t_2 - t_1$ auch wie folgt schreiben:
- \[\varphi_{\rm FZ}(f_1, t_1, f_2, t_2) \hspace{0.3cm} \Rightarrow \hspace{0.3cm}\varphi_{\rm FZ}(\Delta f, \Delta t) = {\rm E} \big [ H(f, t) \cdot H^{\star}(f + \Delta f, t + \Delta t) \big ]\hspace{0.05cm}.\]
Hierzu ist anzumerken:
- Schon an der Namensgebung ist zu erkennen, dass $\varphi_{\rm FZ}(\Delta f, \Delta t)$ eine Korrelationsfunktion ist und kein Leistungsdichtespektrum wie die Funktionen ${\it \Phi}_{\rm VZ}(\tau, \Delta t)$, ${\it \Phi}_{\rm FD}(\Delta f, f_{\rm D})$ und ${\it \Phi}_{\rm VD}(\tau, f_{\rm D})$.
- Die Fourierzusammenhänge mit den benachbarten Funktionen lauten:
- \[{\it \Phi}_{\rm VZ}(\tau, \Delta t) \hspace{0.2cm} \stackrel{\tau, \hspace{0.05cm}\Delta f}{\circ\!\!-\!\!\!-\!\!\!-\!\!\bullet} \hspace{0.2cm} \varphi_{\rm FZ}(\Delta f, \hspace{0.05cm}\Delta t) \hspace{0.2cm} \stackrel{\Delta t,\hspace{0.05cm} f_{\rm D}}{\circ\!\!-\!\!\!-\!\!\!-\!\!\bullet} \hspace{0.2cm} {\it \Phi}_{\rm FD}(\Delta f,\hspace{0.05cm} f_{\rm D}) \hspace{0.05cm}.\]
- Setzt man in dieser 2D– Funktion die Parameter $\Delta t = 0$ bzw. $\Delta f = 0$, so ergeben sich die separaten Korrelationsfunktionen für den Frequenz– bzw. den Zeitbereich:
- \[\varphi_{\rm F}(\Delta f) = \varphi_{\rm FZ}(\Delta f, \Delta t = 0) \hspace{0.05cm},\]
- \[\varphi_{\rm Z}(\Delta t) = \varphi_{\rm FZ}(\Delta f = 0, \Delta t ) \hspace{0.05cm}.\]
- Aus obiger Grafik wird auch deutlich, dass diese Korrelationsfunktionen mit den hergeleiteten Leistungsdichtespektren über die Fouriertransformation korrespondieren:
- \[\varphi_{\rm F}(\Delta f) \hspace{0.2cm} {\bullet\!\!-\!\!\!-\!\!\!-\!\!\circ} \hspace{0.2cm} {\it \Phi}_{\rm V}(\tau)\hspace{0.05cm},
\hspace{0.4cm}\varphi_{\rm Z}(\Delta t) \hspace{0.2cm} {\circ\!\!-\!\!\!-\!\!\!-\!\!\bullet} \hspace{0.2cm} {\it \Phi}_{\rm D}(f_{\rm D})\hspace{0.05cm}.\]
Kenngrößen des GWSSUS–Modells
Entsprechend den Ergebnissen der letzten Seite wird der Mobilfunkkanal durch
- das Verzögerungs–Leistungsdichtespektrum ${\it \Phi}_{\rm V}(\tau)$ und
- das Doppler–Leistungsdichtespektrum ${\it \Phi}_{\rm D}(f_{\rm D})$
vollständig beschrieben. Durch geeignete Normierung auf die jeweilige Fläche $1$ ergeben sich daraus die Dichtefunktionen bezüglich der Verzögerungszeit $\tau$ bzw. der Dopplerfrequenz $f_{\rm D}$.
Aus den Leistungsdichtespektren bzw. den zugehörigen Korrelationsfunktionen können Kenngrößen abgeleitet werden. Die wichtigsten sind hier zusammengestellt:
$\text{Definition:}$ Die Mehrwegeverbreiterung (englisch: Time Delay Spread oder Multipath Spread ) $T_{\rm V}$ gibt die Verbreiterung an, die ein Diracimpuls durch den Kanal im statistischen Mittel erfährt. $T_{\rm V}$ ist definiert als die Standardabweichung $(\sigma_{\rm V})$ der Zufallsgröße $\tau$:
- \[T_{\rm V} = \sigma_{\rm V} = \sqrt{ {\rm E} \big [ \tau^2 \big ] - m_{\rm V}^2} \hspace{0.05cm}.\]
- Der Mittelwert $m_{\rm V} = {\rm E}\big[\tau \big]$ ist eine für alle Signalanteile „gleiche mittlere Laufzeit” (englisch: Average Excess Delay).
- ${\rm E} \big [ \tau^2 \big ] $ ist als quadratischer Mittelwert zu berechnen.
$\text{Definition:}$ Die Kohärenzbandbreite $B_{\rm K}$ (englisch: Coherence Bandwidth ) ist derjenige $\Delta f$–Wert, bei dem der Frequenz–Korrelationsfunktion betragsmäßig erstmals auf die Hälfte abgesunken ist.
- \[\vert \varphi_{\rm F}(\Delta f = B_{\rm K})\vert \stackrel {!}{=} {1}/{2} \cdot \vert \varphi_{\rm F}(\Delta f = 0)\vert \hspace{0.05cm}.\]
- $B_{\rm K}$ ist ein Maß für die Frequenzdifferenz, um die sich zwei harmonische Schwingungen mindestens unterscheiden müssen, damit sie völlig andere Kanalübertragungseigenschaften vorfinden.
- Ist die Signalbandbreite $B_{\rm S} <B_{\rm K}$, so werden alle Spektralanteile durch den Kanal annähernd gleich verändert.
Das heißt: Genau dann liegt nichtfrequenzselektives Fading vor.
$\text{Beispiel 2:}$ In der Grafik links dargestellt ist die Verzögerungsleistungsdichte ${\it \Phi}_{\rm V}(\tau)$
- mit $T_{\rm V} = 1 \ \rm µs$ (rote Kurve),
- mit $T_{\rm V} = 2 \ \rm µ s$ (blaue Kurve).
In der rechten $\varphi_{\rm F}(\Delta f)$–Darstellung sind die Kohärenzbandbreiten eingezeichnet:
- $B_{\rm K} = 276 \ \rm kHz$ (rote Kurve),
- $B_{\rm K} = 138 \ \rm kHz$ (blaue Kurve).
Man erkennt aus diesen Zahlenwerten:
- Die aus ${\it \Phi}_{\rm V}(\tau)$ berechenbare Mehrwegeverbreiterung $T_{\rm V}$ steht mit der durch $\varphi_{\rm F}(\Delta f)$ festgelegten Kohärenzbandbreite $B_{\rm K}$ in einem festen Verhältnis zueinander: $B_{\rm K} \approx 0.276/T_{\rm V}$.
- Die oft benutzte Näherung $B_{\rm K}\hspace{0.02cm}' \approx 1/T_{\rm V}$ ist hingegen bei exponentiellem ${\it \Phi}_{\rm V}(\tau)$ sehr ungenau.
Betrachten wir nun die Zeitvarianz–Kenngrößen, die von der Zeit–Korrelationsfunktion $\varphi_{\rm Z}(\Delta t)$ bzw. vom Doppler–Leistungsdichtespektrum ${\it \Phi}_{\rm D}(f_{\rm D})$ abgeleitet werden:
$\text{Definition:}$ Die Korrelationsdauer $T_{\rm D}$ (englisch: Coherence Time ) gibt die Zeit an, die im Mittel vergehen muss, bis der Kanal seine Übertragungseigenschaften aufgrund der Zeitvarianz völlig geändert hat. Deren Definition ist ähnlich wie die Definition der Kohärenzbandbreite:
- \[\vert \varphi_{\rm Z}(\Delta t = T_{\rm D})\vert \stackrel {!}{=} {1}/{2} \cdot \vert \varphi_{\rm Z}(\Delta t = 0)\vert \hspace{0.05cm}.\]
$\text{Definition:}$ Die Dopplerverbreiterung $B_{\rm D}$ (oder „Fading–Bandbreite”, englisch: Doppler Spread ) ist die mittlere Frequenzverbreiterung, die die einzelnen spektralen Signalanteile erfahren. Bei der Berechnung geht man ähnlich vor wie bei der Mehrwegeverbreiterung, indem man die Dopplerverbreiterung $B_{\rm D}$ als die Standardabweichung der Zufallsgröße $f_{\rm D}$ berechnet:
- \[B_{\rm D} = \sigma_{\rm D} = \sqrt{ {\rm E} \left [ f_{\rm D}^2 \right ] - m_{\rm D}^2} \hspace{0.05cm}.\]
- Zunächst ist aus ${\it \Phi}_{\rm D}(f_{\rm D})$ durch Flächennormierung auf $1$ die Doppler–WDF zu ermitteln.
- Daraus ergeben sich die mittlere Dopplerverschiebung $m_{\rm D} = {\rm E}[f_{\rm D}]$ und die Standardabweichung $\sigma_{\rm D}$.
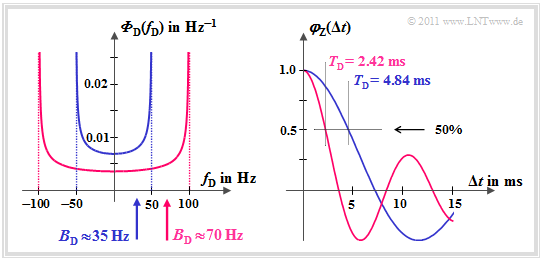
$\text{Beispiel 3:}$ Die Grafik gilt für einen zeitvarianten Kanal ohne Direktkomponente. Links dargestellt ist das Jakes–Spektrum ${\it \Phi}_{\rm D}(f_{\rm D})$.
Die Dopplerverbreiterung $B_{\rm D}$ lässt sich daraus ermitteln:
- \[f_{\rm D,\hspace{0.05cm}max} = 50\,{\rm Hz}\hspace{-0.1cm}: \hspace{-0.1cm}\hspace{0.45cm} B_{\rm D} \approx 35\,{\rm Hz} \hspace{0.05cm},\]
- \[f_{\rm D,\hspace{0.05cm}max} = 100\,{\rm Hz}\hspace{-0.1cm}: \hspace{-0.1cm}\hspace{0.2cm} B_{\rm D} \approx 70\,{\rm Hz} \hspace{0.05cm}.\]
Die Zeitkorrelationsfunktion $\varphi_{\rm Z}(\Delta t)$ als die Fourierrücktransformierte von ${\it \Phi}_{\rm D}(f_{\rm D})$ ist rechts skizziert.
Bei den gegebenen Randbedingungen lautet diese mit der Besselfunktion:
- \[\varphi_{\rm Z}(\Delta t \hspace{-0.05cm} = \hspace{-0.05cm}T_{\rm D}) \hspace{-0.05cm}= \hspace{-0.05cm} {\rm J}_0(2 \pi \hspace{-0.05cm} \cdot \hspace{-0.05cm} f_{\rm D,\hspace{0.05cm}max} \hspace{-0.05cm}\cdot \hspace{-0.05cm}\Delta t ).\]
- Die Korrelationsdauer der blauen Kurve ist $T_{\rm D} = 4.84 \ \rm ms$.
- Für $f_{\rm D,\hspace{0.05cm}max} = 100\,{\rm Hz}$ ist die Korrelationsdauer nur halb so groß.
- Allgemein gilt im vorliegenden Fall: $B_{\rm D} \cdot T_{\rm D}\approx 0.17$.
Simulation gemäß dem GWSSUS–Modell
Das abschließend nur kurz dargelegte Monte–Carlo–Verfahren zur Simulation eines GWSSUS–Mobilfunkkanals basiert auf Arbeiten von Rice [Ric44][1] und Höher [Höh90][2].
- Die 2D–Impulsantwort wird durch eine Summe aus $M$ komplexen Exponentialfunktionen dargestellt. $M$ ist als die Anzahl unterschiedlicher Pfade interpretierbar:
- \[h(\tau,\ t)= \frac{1}{\sqrt {M}} \cdot \sum_{m=1}^{M} \alpha_m \cdot \delta (t - \tau_m) \cdot {\rm e}^{{\rm j} \hspace{0.05cm} \phi_{m} }\cdot {\rm e}^{ {\rm j} \hspace{0.05cm}2 \pi f_{{\rm D},\hspace{0.05cm} m} t} \hspace{0.05cm}. \]
- Vor Beginn werden die Verzögerungen $\tau_m$, die Dämpfungsfaktoren $\alpha_m$, die gleichverteilten Phasen $\phi_m$ und die Dopplerfrequenzen $f_{{\rm D},\hspace{0.05cm} m}$ nach den GWSSUS–Vorgaben „ausgewürfelt”. Grundlage für das Auswürfeln der Dopplerfrequenzen $f_{{\rm D},\hspace{0.05cm} m}$ ist das Jakes–Spektrum ${\it \Phi}_{\rm D}(f_{\rm D})$, das – geeignet normiert – gleichzeitig die WDF der Dopplerfrequenzen angibt.
- Wegen ${\it \Phi}_{\rm VD}(\tau, f_{\rm D}) = {\it \Phi}_{\rm V}(\tau) \cdot {\it \Phi}_{\rm D}(f_{\rm D})$ ist für alle $m$ die Verzögerungszeit $\tau_m$ unabhängig von der Dopplerfrequenz $f_{{\rm D},\hspace{0.05cm} m}$. Für den terrestrischen Landmobilfunk gilt dies mit guter Näherung. Für das Auswürfeln der Parameter $\alpha_m$ und $\tau_m$, die das Verzögerungs–Leistungsdichtespektrum $ {\it \Phi}_{\rm V}(\tau)$ bestimmen, stehen die COST–Profile $\rm RA$ (Rural Area), $\rm TU$ (Typical Urban), $\rm BU$ (Bad Urban) und $\rm HT$ (Hilly Terrain) zur Verfügung.
- Je größer bei der Simulation die Anzahl $M$ unterschiedlicher Pfade gewählt wird, um so besser wird eine reale Impulsantwort durch obige Gleichung angenähert. Die höhere Simulationsgenauigkeit geht allerdings auf Kosten der Simulationsdauer. In der Literatur werden für $M$ günstige Werte zwischen $100$ und $600$ angegeben.
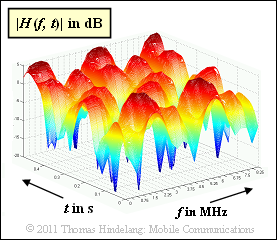
$\text{Beispiel 4:}$ Die Grafik aus [Hin08][3] zeigt ein Simulationsergebnis: Als 2D–Plot ist $20 \cdot \lg \vert H(f, \hspace{0.1cm}t)\vert$ dargestellt, wobei die zeitvariante Übertragungsfunktion $H(f, \hspace{0.1cm}t)$ in diesem Tutorial auch mit $\eta_{\rm FZ}(f, \hspace{0.1cm}t)$ bezeichnet wird.
Der Simulation liegen folgende Parameter zugrunde:
- Die Zeitvarianz entsteht durch eine Bewegung mit $v = 3 \ \rm km/h$.
- Die Trägerfrequenz ist $f_{\rm T} = 2 \ \rm GHz$.
- Die maximale Verzögerungszeit beträgt $\tau_{\rm max} \approx 0.4 \ \rm µ s$.
- Daraus ergibt sich nach der Näherung für die Kohärenzbandbreite $B_{\rm K}\hspace{0.02cm}' \approx 2.5 \ \rm MHz$.
- Die maximale Dopplerfrequenz ist $f_\text{D, max} \approx 5.5 \ \rm Hz$.
- Die Dopplerverbreiterung ergibt sich zu $B_{\rm D} \approx 4 \ \rm Hz$.
Aufgaben zum Kapitel
Aufgabe 2.5Z: Mehrwege-Szenario
Aufgabe 2.6: Einheiten bei GWSSUS
Aufgabe 2.7: Kohärenzbandbreite
Aufgabe 2.7Z: Kohärenzbandbreite des LZI–Zweiwegekanals
Aufgabe 2.8: COST-Verzögerungsmodelle
Aufgabe 2.9: Korrelationsdauer
Quellenverzeichnis
- ↑ Rice, S.O.: Mathematical Analysis of Random Noise. BSTJ–23, pp. 282–232 und BSTJ–24, pp. 45–156, 1945.
- ↑ Höher, P.: Empfang trelliscodierter PSK–Signale auf frequenzselektiven Mobilfunkkanälen – Entzerrung, Decodierung und Kanalschätzung. Düsseldorf: VDI–Verlag, Fortschrittsberichte, Reihe 10, Nr. 147, 1990.
- ↑ Hindelang, T.: Mobile Communications. Vorlesungsmanuskript. Lehrstuhl für Nachrichtentechnik, TU München, 2008.
