Exercise 4.3: Pointer Diagram Representation
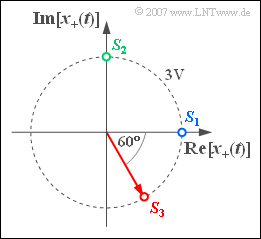
We consider an analytical signal $x_+(t)$, which is defined by the drawn diagram in the complex plane. Depending on the choice of signal parameters, this results in three physical bandpass signals $x_1(t)$, $x_2(t)$ and $x_3(t)$, which differ by different starting points $S_i = x_i(t = 0)$ unterscheiden (blue, green and red point). In addition, the angular velocities of the three constellations are also different:
- The analytical signal $x_{1+}(t)$ starts at $S_1 = 3 \ \rm V$. The angular velocity is $\omega_1 = \pi \cdot 10^{4} \ 1/\text{s}$.
- The signal $x_{2+}(t)$ starts at the green starting point $S_2 = {\rm j} \cdot 3 \ \text{V}$ and, compared to $x_{1+}(t)$ , rotates with twice the angular velocity ⇒ $\omega_2 = 2 \cdot \omega_1$.
- The signal $x_{3+}(t)$ starts at the red marked starting point $S_3 = 3 \ \text{V} \cdot \text{e}^{–\text{j}\hspace{0.05cm}\cdot\hspace{0.05cm}\pi /3}$ and rotates with the same speed as the signal $x_{2+}(t)$.
Hints:
- This exercise belongs to the chapter Analytical Signal and Its Spectral Function.
- The interactive applet Physikalisches Signal & Analytisches Signal illustrates the topic covered here.
Questions
Solution
(2) The sought frequency is given by $f_1 = \omega_1/(2\pi ) \; \underline{= 5 \ \text{kHz}}$.
- The phase can be determined from $S_1 = 3 \ \text{V} \cdot \text{e}^{–\text{j} \hspace{0.05cm}\cdot \hspace{0.05cm} \varphi_1}$ and is $\varphi_1 \; \underline{= 0}$.
- In total this gives
- $$x_1(t) = 3\hspace{0.05cm}{\rm V} \cdot {\cos} ( 2 \pi \cdot {\rm 5 \hspace{0.05cm} kHz}\cdot t) .$$
(3) Because of $\omega_2 = 2\cdot \omega_1$ , the frequency is now $f_2 = 2 \cdot f_1 \; \underline{= 10 \ \text{kHz}}$.
- The phase is obtained with the starting time $S_2$ at $\text{e}^{–\text{j}\hspace{0.05cm} \cdot \hspace{0.05cm}\varphi_2} = \text{j}$ ⇒ $\varphi_2 \; \underline{= -\pi /2 \; (-90^{\circ})}$.
- Thus the time function is:
- $$x_2(t) = 3\hspace{0.05cm}{\rm V} \cdot {\cos} ( 2 \pi \cdot {\rm 10 \hspace{0.05cm} kHz}\cdot t + 90^\circ) = -3\hspace{0.05cm}{\rm V} \cdot {\sin} ( 2 \pi \cdot {\rm 10 \hspace{0.05cm} kHz}\cdot t ).$$
This signal is "minus-sine", which can also be read directly from the pointer diagram:
- The real part of $x_{2+}(t)$ at time $t = 0$ is zero. Since the pointer turns counterclockwise, the real part is negative at first.
- After a quarter turn, $x_2(T/4) = - 3 \ \text{V}$.
- If one continues to turn counterclockwise in steps of $90^\circ$ , the signal values $0 \ \text{V}$, $3 \ \text{V}$ and $0 \ \text{V}$ result.
(4) This sub-task can be solved analogously to questions (2) and (3) :
- $$f_3 \; \underline{= 10 \ \text{kHz}}, \ \varphi_3 \; \underline{= 60^\circ}.$$
(5) The pointer requires exactly the period $T_3 = 1/f_3 \; \underline{= 0.1 \ \text{ms}} \;(= t_1)$ for one revolution..
(6) The analytical signal starts at $S_3 = 3 \ \text{V} \cdot \text{e}^{–\text{j}\hspace{0.05cm} \cdot \hspace{0.05cm}60^{\circ}}$.
- If the signal rotates further by $120^\circ$ , exactly the same real part results.
- The following relationship then applies with $t_2 = t_1/3 \; \underline{= 0.033 \ \text{ms}} $ :
- $$x_3(t = t_2) = x_3(t = 0) = 3\hspace{0.05cm}{\rm V} \cdot {\cos} ( 60^\circ) = 1.5\hspace{0.05cm}{\rm V} .$$
