Contents
# OVERVIEW OF THE FIFTH MAIN CHAPTER #
A prerequisite for the system-theoretical investigation of digital systems or for their computer simulation is a suitable discrete-time signal description.
This chapter clarifies the mathematical transition from continuous-time to discrete-time signals, starting from the $\text{Fourier transform theorems}$.
The chapter includes in detail:
- The »time and frequency domain representation« of discrete-time signals,
- the »sampling theorem«, which must be strictly observed in time discretization,
- the »reconstruction of the analog signal« from the discrete-time representation,
- the »Discrete Fourier Transform« $\rm (DFT)$ and its inverse $\rm (IDFT)$,
- the »possibilities for error« when applying DFT and IDFT,
- the application of »spectral analysis« to the improvement of metrological procedures, and
- the »FFT algorithm« particularly suitable for computer implementation.
Principle and motivation
Many source signals are analog and thus simultaneously $\text{continuous-time}$ and $\text{continuous}$. If such an analog signal is to be transmitted by means of a digital system, the following preprocessing steps are required:
- the $\text{sampling}$ of the source signal $x(t)$, which is expediently - but not necessarily - performed at equidistant times ⇒ $\text{time discretization}$,
- the $\text{quantization}$ of the samples, so as to limit the number $M$ of possible values to a finite value ⇒ $\text{value discretization}$.
Quantization is not discussed in detail until the chapter "Pulse Code Modulation" of the book "Modulation Methods".
In the following, we use the following nomenclature to describe the sampling:
- Let the continuous-time signal be $x(t)$.
- Let the sampled signal sampled at equidistant intervals $T_{\rm A}$ be $x_{\rm A}(t)$.
- Let the run variable $\nu$ of the sample be an $\text{integer}$:
- $$\nu \in \mathbb{Z} = \{\hspace{0.05cm} \text{...}\hspace{0.05cm} , –3, –2, –1, \hspace{0.2cm}0, +1, +2, +3, \text{...} \hspace{0.05cm}\} .$$
- Outside the sampling time points $\nu \cdot T_{\rm A}$ always holds $x_{\rm A}(t) = 0$.
- At the equidistant sampling times with the constant $K$, the result is:
- $$x_{\rm A}(\nu \cdot T_{\rm A}) = K \cdot x(\nu \cdot T_{\rm A})\hspace{0.05cm}.$$
- $K$ depends on the time discretization type. For the sketch: $K = 1$.
Time domain representation
$\text{Definition:}$ Here, $\text{"sampling"}$ shall be understood as the multiplication of the continuous-time signal $x(t)$ by the Dirac comb $p_{\delta}(t)$:
- $$x_{\rm A}(t) = x(t) \cdot p_{\delta}(t)\hspace{0.05cm}.$$
It should be noted that other description forms are found in the literature. However, to the authors, the form chosen here appears to be the most appropriate in terms of spectral representation and derivation of the $\text{Discrete Fourier Transform}$ $\rm (DFT)$.
$\text{Definition:}$ The $\text{Dirac comb}$ (in the time domain) consists of infinitely many Dirac deltas, each equally spaced $T_{\rm A}$ and all with equal impulse weight $T_{\rm A}$:
- $$p_{\delta}(t) = \sum_{\nu = - \infty }^{+\infty} T_{\rm A} \cdot \delta(t- \nu \cdot T_{\rm A} )\hspace{0.05cm}.$$
Sometimes $p_{\delta}(t)$ is also called "Dirac delta train".
Based on this definition, the sampled signal $x_{\rm A}(t)$ has the following properties:
- The sampled signal at the considered time $(\nu \cdot T_{\rm A})$ is equal to $T_{\rm A} \cdot x(\nu \cdot T_{\rm A}) \cdot \delta (0)$.
- Since the Dirac delta function $\delta (t)$ is infinite at time $t = 0$ all signal values $x_{\rm A}(\nu \cdot T_{\rm A})$ are also infinite.
- Thus, the factor $K$ introduced in the last section is actually infinite as well.
- However, two samples $x_{\rm A}(\nu_1 \cdot T_{\rm A})$ and $x_{\rm A}(\nu_2 \cdot T_{\rm A})$ differ in the same proportion as the signal values $x(\nu_1 \cdot T_{\rm A})$ and $x(\nu_2 \cdot T_{\rm A})$.
- The samples of $x(t)$ appear in the weights of the Dirac delta functions:
- $$x_{\rm A}(t) = \sum_{\nu = - \infty }^{+\infty} T_{\rm A} \cdot x(\nu \cdot T_{\rm A})\cdot \delta (t- \nu \cdot T_{\rm A} )\hspace{0.05cm}.$$
- The additional multiplication by $T_{\rm A}$ is necessary so that $x(t)$ and $x_{\rm A}(t)$ have the same unit. Note here that $\delta (t)$ itself has the unit "1/s".
The following sections will show that these equations, which take some getting used to, do lead to reasonable results, if they are applied consistently.
Dirac comb in time and frequency domain
$\text{Theorem:}$ Developing the $\text{Dirac comb}$ into a $\text{Fourier series}$ and transforming it into the frequency domain using the $\text{Shifting Theorem}$ gives the following Fourier correspondence:
- $$p_{\delta}(t) = \sum_{\nu = - \infty }^{+\infty} T_{\rm A} \cdot \delta(t- \nu \cdot T_{\rm A} )\hspace{0.2cm}\circ\!\!-\!\!\!-\!\!\!-\!\!\bullet\, \hspace{0.2cm} P_{\delta}(f) = \sum_{\mu = - \infty }^{+\infty} \delta (f- \mu \cdot f_{\rm A} ).$$
Here $f_{\rm A} = 1/T_{\rm A}$ gives the distance between two adjacent Dirac lines in the frequency domain.
$\text{Proof:}$ The derivation of the spectral function $P_{\delta}(f)$ given here is done in several steps:
(1) Since $p_{\delta}(t)$ is periodic with the constant distance $T_{\rm A}$ between two Dirac lines, the $\text{complex Fourier series}$ can be applied:
- $$p_{\delta}(t) = \sum_{\mu = - \infty }^{+\infty} D_{\mu} \cdot {\rm e}^{\hspace{0.05cm}{\rm j} \hspace{0.05cm} \cdot 2 \hspace{0.05cm} \pi \hspace{0.05cm}\cdot \hspace{0.05cm}\mu \hspace{0.05cm}\cdot \hspace{0.05cm}t/T_{\rm A} } \hspace{0.3cm}{\rm with}\hspace{0.3cm} D_{\mu} = \frac{1}{T_{\rm A} } \cdot \int_{-T_{\rm A}/2 }^{+T_{\rm A}/2}p_{\delta}(t) \cdot {\rm e}^{- {\rm j} \hspace{0.05cm}\cdot \hspace{0.05cm} 2 \pi \hspace{0.05cm}\cdot \hspace{0.05cm}\mu \hspace{0.05cm} \cdot \hspace{0.05cm}t/T_{\rm A} }\hspace{0.1cm} {\rm d}t\hspace{0.05cm}.$$
(2) In the range from $-T_{\rm A}/2$ to $+T_{\rm A}/2$ holds for the Dirac comb in the time domain: $p_{\delta}(t) = T_{\rm A} \cdot \delta(t)$. Thus one can write for the complex Fourier coefficients:
- $$D_{\mu} = \int_{-T_{\rm A}/2 }^{+T_{\rm A}/2}{\delta}(t) \cdot {\rm e}^{- {\rm j} \hspace{0.05cm}\cdot \hspace{0.05cm} 2 \pi \hspace{0.05cm}\cdot \hspace{0.05cm}\mu \hspace{0.05cm} \cdot \hspace{0.05cm}t/T_{\rm A} }\hspace{0.1cm} {\rm d}t\hspace{0.05cm}.$$
(3) Considering that for $t \neq 0$ the Dirac delta is zero and for $t = 0$ the complex rotation factor is equal to $1$, it holds further:
- $$D_{\mu} = \int_{- T_{\rm A}/2 }^{+T_{\rm A}/2}{\delta}(t) \hspace{0.1cm} {\rm d}t = 1\hspace{0.5cm}{\Rightarrow}\hspace{0.5cm} p_{\delta}(t) = \sum_{\mu = - \infty }^{+\infty} {\rm e}^{ {\rm j} \hspace{0.05cm} \cdot 2 \hspace{0.05cm} \pi \cdot \hspace{0.05cm}\mu \hspace{0.05cm}\cdot \hspace{0.05cm}t/T_{\rm A} }\hspace{0.05cm}. $$
(4) The $\text{Shifting Theorem in the frequency domain}$ with $f_{\rm A} = 1/T_{\rm A}$:
- $${\rm e}^{ {\rm j} \hspace{0.05cm} \hspace{0.05cm} \cdot 2 \hspace{0.05cm} \pi \hspace{0.05cm}\cdot \hspace{0.05cm}\mu \hspace{0.05cm}\cdot \hspace{0.05cm} f_{\rm A}\hspace{0.05cm}\cdot \hspace{0.05cm}t}\hspace{0.2cm}\circ\!\!-\!\!\!-\!\!\!-\!\!\bullet\, \hspace{0.2cm} \delta (f- \mu \cdot f_{\rm A} )\hspace{0.05cm}.$$
(5) If you apply this result to each individual summand, you finally get:
- $$P_{\delta}(f) = \sum_{\mu = - \infty }^{+\infty} \delta (f- \mu \cdot f_{\rm A} )\hspace{0.05cm}.$$
The result states:
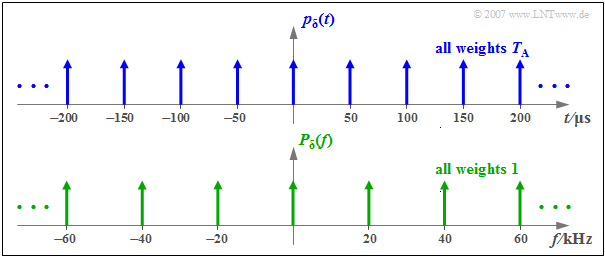
- The Dirac comb $p_{\delta}(t)$ in the time domain consists of infinitely many Dirac deltas, each at the same distance $T_{\rm A}$ and all with the same impulse weight $T_{\rm A}$.
- The Fourier transform of $p_{\delta}(t)$ gives again a Dirac comb, but now in the frequency range ⇒ $P_{\delta}(f)$.
- $P_{\delta}(f)$ also consists of infinitely many Dirac deltas, but now in the respective distance $f_{\rm A} = 1/T_{\rm A}$ and all with impulse weights $1$.
- The distances of the Dirac lines in the time and frequency domain representation thus follow the $\text{Reciprocity Theorem}$:
- $$T_{\rm A} \cdot f_{\rm A} = 1 \hspace{0.05cm}.$$
$\text{Example 1:}$ The graph illustrates the above statements for
- $T_{\rm A} = 50\,{\rm µs}$,
- $f_{\rm A} = 1/T_{\rm A} = 20\,\text{kHz}$ .
One can also see from this sketch the different impulse weights of $p_{\delta}(t)$ and $P_{\delta}(f)$.
Frequency domain representation
The spectrum of the sampled signal $x_{\rm A}(t)$ is obtained by applying the $\text{Convolution Theorem in the frequency domain}$. This states that multiplication in the time domain corresponds to convolution in the spectral domain:
- $$x_{\rm A}(t) = x(t) \cdot p_{\delta}(t)\hspace{0.2cm}\circ\!\!-\!\!\!-\!\!\!-\!\!\bullet\, \hspace{0.2cm} X_{\rm A}(f) = X(f) \star P_{\delta}(f)\hspace{0.05cm}.$$
From the spectrum $X(f)$ by convolution with the Dirac line shifted by $\mu \cdot f_{\rm A}$ we get:
- $$X(f) \star \delta (f- \mu \cdot f_{\rm A} )= X (f- \mu \cdot f_{\rm A} )\hspace{0.05cm}.$$
Applying this result to all Dirac lines of the Dirac comb, we finally obtain:
- $$X_{\rm A}(f) = X(f) \star \sum_{\mu = - \infty }^{+\infty} \delta (f- \mu \cdot f_{\rm A} ) = \sum_{\mu = - \infty }^{+\infty} X (f- \mu \cdot f_{\rm A} )\hspace{0.05cm}.$$
$\text{Conclusion:}$ The sampling of the analog time signal $x(t)$ at equidistant intervals $T_{\rm A}$ leads in the spectral domain to a $\text{periodic continuation}$ of $X(f)$ with frequency spacing $f_{\rm A} = 1/T_{\rm A}$.
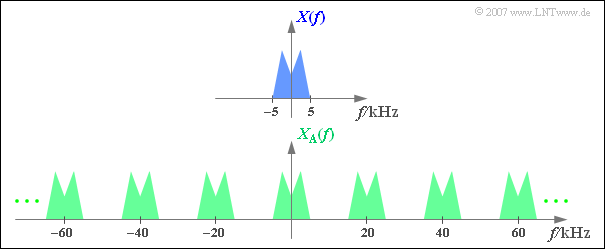
$\text{Example 2:}$ The upper graph shows (schematically!) the spectrum $X(f)$ of an analog signal $x(t)$, which includes frequencies up to $5 \text{ kHz}$ .
Sampling the signal at the sampling rate $f_{\rm A}\,\text{ = 20 kHz}$, i.e. at the respective distance $T_{\rm A}\, = {\rm 50 \, µs}$ we obtain the periodic spectrum $X_{\rm A}(f)$ sketched below.
- Since the Dirac delta functions are infinitely narrow, the sampled signal $x_{\rm A}(t)$ also contains arbitrary high-frequency components.
- Accordingly, the spectral function $X_{\rm A}(f)$ of the sampled signal is extended to infinity.
Signal reconstruction
Signal sampling is not an end in itself in a digital transmission system; it must be reversed at some point. Consider, for example, the following system:
- The analog signal $x(t)$ with bandwidth $B_{\rm NF}$ is sampled as described above.
- At the output of an ideal transmission system, the likewise discrete-time signal $y_{\rm A}(t) = x_{\rm A}(t)$ is present.
- The question now is how the block $\text{signal reconstruction}$ is to be designed so that $y(t) = x(t)$ applies.
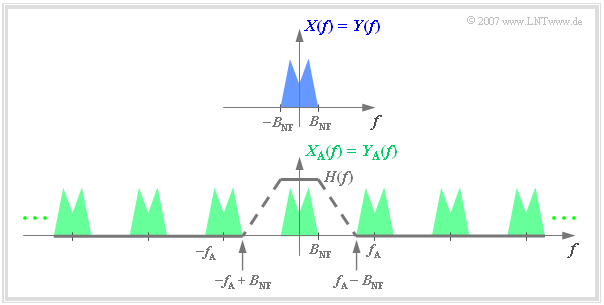
The solution is simple if one considers the spectral functions: One obtains from $Y_{\rm A}(f)$ the spectrum $Y(f) = X(f)$ by a low-pass with $\text{frequency response}$ $H(f)$, which
- passes the low frequencies unaltered:
- $$H(f) = 1 \hspace{0.3cm}{\rm{for}} \hspace{0.3cm} |f| \le B_{\rm NF}\hspace{0.05cm},$$
- suppresses the high frequencies completely:
- $$H(f) = 0 \hspace{0.3cm}{\rm{for}} \hspace{0.3cm} |f| \ge f_{\rm A} - B_{\rm NF}\hspace{0.05cm}.$$
Further it can be seen from the graph that the frequency response $H(f)$ can be arbitrarily shaped in the range of $B_{\rm NF}$ to $f_{\rm A}-B_{\rm NF}$, as long as both of the above conditions are met,
- for example, linearly sloping (dashed line)
- or also rectangular-in-frequency.
Sampling theorem
The complete reconstruction of the analog signal $y(t)$ from the sampled signal $y_{\rm A}(t) = x_{\rm A}(t)$ is only possible if the sampling rate $f_{\rm A}$ corresponding to the bandwidth $B_{\rm NF}$ of the source signal has been chosen correctly.
From the graph in the "last section" , it can be seen that the following condition must be fulfilled:
- $$f_{\rm A} - B_{\rm NF} > B_{\rm NF} \hspace{0.3cm}\Rightarrow \hspace{0.3cm}f_{\rm A} > 2 \cdot B_{\rm NF}\hspace{0.05cm}.$$
$\text{Sampling Theorem:}$ If an analog signal $x(t)$ has spectral components in the range $\vert f \vert < B_{\rm NF}$, it only can be completely reconstructed from its sampled signal $x_{\rm A}(t)$ if the sampling rate is sufficiently large:
- $$f_{\rm A} ≥ 2 \cdot B_{\rm NF}.$$
Accordingly, the following must apply to the distance between two samples:
- $$T_{\rm A} \le \frac{1}{ 2 \cdot B_{\rm NF} }\hspace{0.05cm}.$$
If the largest possible value ⇒ $T_{\rm A} = 1/(2B_{\rm NF})$ is used for sampling,
- then, in order to reconstruct the analog signal from its sampled values,
- one must use an ideal, rectangular low-pass filter with cut-off frequency $f_{\rm G} = f_{\rm A}/2 = 1/(2T_{\rm A})$ .
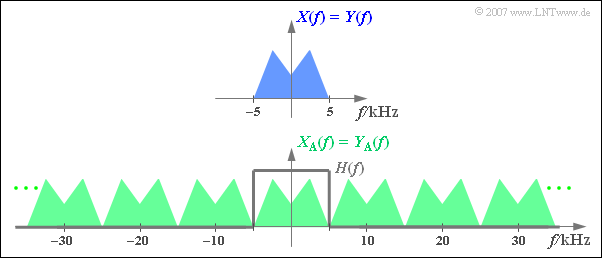
$\text{Example 3:}$ The graph above shows the spectrum $X(f)$ of an analog signal limited to $\pm\text{ 5 kHz}$. Below you see the spectrum $X_{\rm A}(f)$ of the sampled signal with $T_{\rm A} =\,\text{ 100 µs}$ ⇒ $f_{\rm A}=\,\text{ 10 kHz}$.
Additionally drawn is the frequency response $H(f)$ of the low-pass filter for signal reconstruction, whose cut-off frequency must be $f_{\rm G} = f_{\rm A}/2 = 5\,\text{ kHz}$.
- With any other $f_{\rm G}$ value, the result would be $Y(f) \neq X(f)$.
- For $f_{\rm G} < 5\,\text{ kHz}$ the upper $X(f)$ parts are missing.
- For $f_{\rm G} > 5\,\text{ kHz}$ there are unwanted spectral components in $Y(f)$ due to convolution operations.
If the sampling at the transmitter had been done with a sampling rate $f_{\rm A} < 10\,\text{ kHz}$ ⇒ $T_{\rm A} >100 \,{\rm µ s}$, the analog signal $y(t) = x(t)$ would not be reconstructible from the samples $y_{\rm A}(t)$ in any case.
Note: There is an interactive applet on the topic covered here: "Sampling of Analog Signals and Signal Reconstruction"
Exercises for the chapter
Exercise 5.1: Sampling Theorem
Exercise 5.1Z: Sampling of Harmonic Oscillations


