Exercise 4.15: Optimal Signal Space Allocation
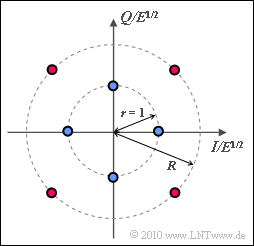
A signal space constellation with $M = 8$ signal space points is considered here:
- Four points lie on a circle with radius $r = 1$.
- Four further points lie offset by $45^\circ$ on a second circle with radius $R$, where the following shall hold:
- $$R_{\rm min} \le R \le R_{\rm max}\hspace{0.05cm},\hspace{0.2cm} R_{\rm min}= \frac{ \sqrt{3}-1}{ \sqrt{2}} \approx 0.518 \hspace{0.05cm},\hspace{0.2cm} R_{\rm max}= \frac{ \sqrt{3}+1}{ \sqrt{2}} \approx 1.932\hspace{0.05cm}.$$
Let the two axes (basis functions) be normalized respectively and denoted $I$ and $Q$ for simplicity. For further simplification, $E = 1$ can be set.
In the question section, we speak of blue and red points. According to the diagram, the blue points lie on the circle with radius $r = 1$, the red points on the circle with radius $R$. The case $R = R_{\rm max}$ is drawn.
The system parameter $R$ is to be determined in this exercise in such a way that the quotient
- $$\eta = \frac{ (d_{\rm min}/2)^2}{ E_{\rm B}} $$
becomes maximum. $\eta$ is a measure for the quality of a modulation alphabet at given transmission energy per bit ("Power Efficiency"). It is calculated from
- the minimum distance $d_{\rm min}$, and
- the bit energy $E_{\rm B}$.
It must be ensured that $d_{\rm min}^2$ and $E_{\rm B}$ are normalized in the same way, but this is already implicit in the exercise.
Notes:
- The exercise belongs to the chapter "Carrier Frequency Systems with Coherent Demodulation".
- Reference is made in particular to the sections "Quadrature amplitude modulation" and "Multilevel phase modulation".
Questions
Solution
- $$E_{\rm S} = {1}/{8 } \cdot ( 4 \cdot r^2 + 4 \cdot R^2) = ({1 + R^2})/{2 } \hspace{0.3cm}\Rightarrow \hspace{0.3cm} E_{\rm B} = {E_{\rm S}}/{3} = ({1 + R^2})/{6} \hspace{0.05cm}.$$
In particular:
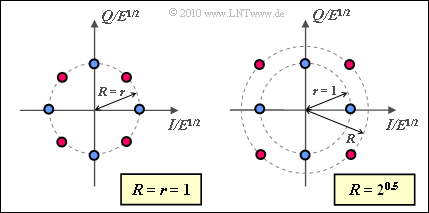
- For $R = 1$, there is an 8–PSK ⇒ $E_{\rm S} = 1$ and $E_{\rm B} \ \underline {= 0.333}$ (see left graph).
- The right graph is valid for $R = \sqrt{2}$. In this case, $E_{\rm B} \ \underline {= 0.5}$.
Note that these energies actually still have to be multiplied by the normalization energy $E$.
(2) All statements are true:
- In the drawn example on the information section with $R = R_{\rm max}$, the distance between two neighboring blue points is exactly the same as the distance between a red (outer) and a blue (inner) point.
- For $R > R_{\rm max}$, the distance between two blue points is the smallest.
- For $R < R_{\rm min}$, the minimum distance occurs between two red points.
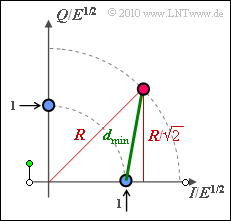
(3) The graphic illustrates the geometric calculation. With "Pythagoras" one obtains:
- $$d_{\rm min}^2 =(R/\sqrt{2})^2 + (R/\sqrt{2}-1)^2 = 1 - \sqrt{2} \cdot R + R^2 \hspace{0.3cm} \Rightarrow \hspace{0.3cm}d_{\rm min} = \sqrt{ 1 - \sqrt{2} \cdot R + R^2} \hspace{0.05cm}.$$
In particular, for $R = 1$ (8–PSK):
- $$d_{\rm min} = \sqrt{ 2 - \sqrt{2} } \hspace{0.1cm} \underline{= 0.765} \hspace{0.1cm} (= 2 \cdot \sin (22.5^{\circ}) ) \hspace{0.05cm}.$$
In contrast, for $\underline {R = \sqrt{2}}$ corresponding to the right graph for subtask (1), the minimum distance is $d_{\rm min} \ \underline {= 1}$.
(4) Using the results of (1) and (3), we obtain in general or for $R = 1$ (8–PSK):
- $$\eta = \frac{ d_{\rm min}^2}{ 4 \cdot E_{\rm B}} = \frac{ 1 - \sqrt{2} \cdot R + R^2}{ 4 \cdot (1 + R^2)/6} = \frac{ 3/2 \cdot(1 - \sqrt{2} \cdot R + R^2)}{ 1 + R^2}\hspace{0.3cm} \Rightarrow \hspace{0.3cm} R = 1: \hspace{0.2cm}\eta = \frac{ 3/2 \cdot(2 - \sqrt{2}) }{ 2} = 3/4 \cdot(2 - \sqrt{2})\hspace{0.1cm} \underline{\approx 0.439}\hspace{0.05cm}.$$
(5) For $R = R_{\rm min} = (\sqrt{3}-1)/\sqrt{2}$, the following value is obtained:
- $$\eta = \frac{ 3/2 \cdot(1 - \sqrt{2} \cdot R + R^2)}{ 1 + R^2} = 3/2 \cdot \left [ 1 - \frac{ \sqrt{2} \cdot R }{ 1 + R^2}\right ]\hspace{0.05cm},$$
- $$\sqrt{2} \cdot R = \sqrt{3}- 1\hspace{0.05cm},\hspace{0.2cm} 1 + R^2 = 3 - \sqrt{3} \hspace{0.3cm}\Rightarrow \hspace{0.3cm} \eta = 3/2 \cdot \left [ 1 - \frac{ \sqrt{3}- 1 }{ 3 - \sqrt{3}}\right ]\hspace{0.1cm} \underline{\approx 0.634}\hspace{0.05cm}.$$
For $R = R_{\rm max}= (\sqrt{3}+1)/\sqrt{2}$ exactly the same value results.
- The (always desired) maximum of the power efficiency $\eta$ results, for example, for $R = R_{\rm max}$ – i.e. for the signal space constellation in the information section.
- In this case all triangles of two neighboring blue points and the red point in between are equilateral.
- Also for $R = R_{\rm min}$ there are equilateral triangles, but now each formed by two red and one blue point.
- In this case the edge length $d_{\rm min}$ is clearly smaller, but at the same time a smaller $E_{\rm B}$ results, so that the power efficiency $\eta$ has the same value.
The previously considered special cases $R = 1$ (8–PSK, left graph in the first subtask) and $R = \sqrt{2}$ (right graph) have a noticeably smaller $\eta$ with $\eta = 0.439$ and $\eta = 0.5$, respectively (compared to $\eta = 0.634$).


