Exercise 4.2: UMTS Radio Channel Basics
From LNTwww
UMTS also has quite a few effects leading to degradation that must be taken into account during system planning:
- ${\rm Interference}$: Since all users are simultaneously served in the same frequency band, each user is interfered by other users.
- ${\rm Path\:loss}$: The received power $P_{\rm E}$ of a radio signal decreases with distance $d$ by a factor $d^{- \gamma}$ .
- ${\rm Multipath\:reception}$: The signal reaches the mobile receiver not only through the direct path, but through several paths – differently attenuated and differently delayed.
- ${\rm Doppler\:effect}$: If transmitter and/or receiver move, frequency shifts can occur depending on direction (Which angle? Towards each other? Away from each other?) and speed.
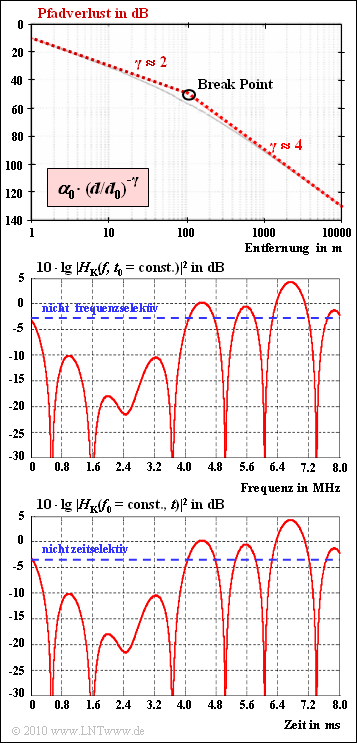
In the book "Mobile Communications" these effects have already been discussed in detail. The diagrams convey only a few pieces of information regarding
- Path loss: Path loss indicates the decrease in received power with distance $d$ from the transmitter. Above the so-called break point applies approximately to the received power:
- $$\frac{P(d)}{P(d_0)} = \alpha_0 \cdot \left ( {d}/{d_0}\right )^{-4}.$$
- According to the upper graph $\alpha_{0} = 10^{-5}$ $($correspondingly $50 \ \rm dB)$ and $d_{0} = 100 \ \rm m$.
- Frequency-selective fading: The power transfer function $|H_{\rm K}(f)|^{2}$ at a given time according to the middle graph illustrates frequency-selective fading. The blue-dashed horizontal line, on the other hand, indicates non-frequency-selective fading.
- Such frequency-selective fading occurs when the coherence bandwidth $B_{\rm K}$ is much smaller than the signal bandwidth $B_{\rm S}$ . Here, with the delayspread $T_{\rm V}$ ⇒ difference between the maximum and minimum delay times:
- $$B_{\rm K}\approx \frac{1}{T_{\rm V}}= \frac{1}{\tau_{\rm max}- \tau_{\rm min}}.$$
- Time-selective fading: The bottom graph shows the power transfer function $|H_{\rm K}(t)|^{2}$ for a fixed frequency $f_{0}$. The sketch is to be understood "schematically", because for the time-selective fading considered here exactly the same course was chosen as in the middle diagram for the frequency-selective fading (pure convenience of the author).
- Here a so-called Doppler spread $B_{\rm D}$ arises, defined as the difference between the maximum and the minimum Doppler frequency. The inverse $T_{\rm D} = 1/B_{\rm D}$ is called coherence time or also correlation duration . In UMTS, time-selective fading occurs whenever $T_{\rm D} \ll T_{\rm C}$ (chip duration) is.
Hints:
- This exercise belongs to the subject area of "General Description of UMTS".
- Reference is made in particular to the pages "Properties of the UMTS radio channel" and "Frequency- and time-selective fading".
- For UMTS, the bandwidth is $B_{\rm S} = 5 \ \rm MHz$ and the chip duration is $T_{\rm C} \approx 0.26 \ \rm µ s$.
Questions
Musterlösung
(1) Entsprechend der Skizze liegt der Breakpoint bei $d_{0} = 100 \ \rm m$.
- Für $d ≤ d_{0}$ ist der Pfadverlust gleich $\alpha_{0} \cdot (d/d_{0})^{–2}$. Für $d = d_{0} = 100 \ \rm m$ gilt:
- $${\rm Pfadverlust} = \alpha_0 = 10^{-5}\hspace{0.5cm}\Rightarrow\hspace{0.5cm}{50\,{\rm dB}}.$$
- Oberhalb von $d_{0}$ ist der Pfadverlust gleich $\alpha_{0} \cdot (d/d_{0})^{–4}$. Somit erhält man in $5 \ \rm km$ Entfernung:
- $${\rm Pfadverlust} = 10^{-5}\cdot 50^{-4} = 1.6 \cdot 10^{-12}\hspace{0.5cm}\Rightarrow\hspace{0.5cm}\underline{118\,{\rm dB}}.$$
(2) Richtig sind die Aussagen 1, 3 und 4:
- Das frequenzselektive Fading ist auf Mehrwegeempfang zurückzuführen. Das bedeutet:
- Unterschiedliche Frequenzanteile werden durch den Kanal unterschiedlich verzögert und gedämpft.
- Dadurch entstehen Dämpfungs– und Phasenverzerrungen.
- Wegen $\tau_{\rm max} = 1 \ \rm µ s$ (vereinfachend wird $\tau_{\rm min} = 0$ gesetzt) ergibt sich weiter
- $$B_{\rm K} = \frac{1}{\tau_{\rm max}- \tau_{\rm min}} = 1\,{\rm MHz}\ \ll \ B_{\rm S} \hspace{0.15cm}\underline {= 5\,{\rm MHz}}.$$
(3) Richtig ist die Aussage 2.
- Die Aussagen 1 und 3 gelten dagegen für frequenzselektives Fading – siehe Teilaufgabe (2).
