Contents
Time invariant Description of the two-way channel
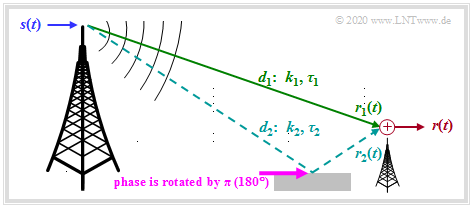
We assume the scenario shown in the graph. This assumes
- Transmitter and receiver are at rest:
Then both the channel–transfer function and the impulse response are time independent. For all times $t$ applies $H(f, \hspace{0.05cm}t) = H(f)$ and $h(\tau, \hspace{0.05cm}t) = h(\tau)$.
- A two-way channel:
The transmit signal $s(t)$ reaches the receiver on a direct path with the path length $d_1$. There is an echo due to the reflective ground $($the total path length is $d_2)$.
Thus, the following applies to the received signal:
- \[r(t) = r_1(t) + r_2(t) = k_1 \cdot s( t - \tau_1) + k_2 \cdot s( t - \tau_2) \hspace{0.05cm}.\]
The following statements should be noted:
- Compared to the transmitted signal, the signal $r_1(t)$ received via the direct path is attenuated by the factor $k_1$ and delayed by $\tau_1$ .
.
- The attenuation factor $k_1$ is calculated with the path loss model . The greater the transmission frequency $f_{\rm S}$, the distance $d_1$ and the exponent $\gamma$ are, the smaller $k_1$ is and thus the greater the loss is.
- The delay $\tau_1 = d_1/c$ increases proportionally with the path length $d_1$ . For example, for the distance $d_1 = 3 \ \rm km$ and the speed of light $c = 3 \cdot 10^8 \ \rm m/s$ the delay will be $\tau_1 = 10 \ \rm µ s$.
- Because of the larger path length $(d_2 > d_1)$ the second path has a greater attenuation ⇒ smaller pre-factor ⇒ $(|k_2| < |k_1|)$ and accordingly also a greater delay $(\tau_2 > \tau_1)$.
- In addition, it must be taken into account that the reflection from buildings or the ground leads to a phase rotation of $\pi \ (180^\circ)$ This causes the factor $k_2$ to become negative. In the following, however, the negative sign of $k_2$ is ignored.
Note: We refer here to the applet effects of multipath reception .
Simple time invariant model of the two-way channel
For the frequency selectivity
- the path loss $($marked by $k_1)$ and
- the basic term $\tau_1$
are irrelevant. The only decisive factors here are path loss differences and runtime differences.
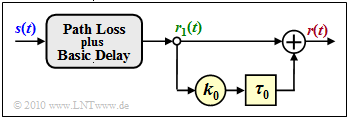
We will now describe the two-way channel with the new parameters
- $$k_0 = |k_2 /k_1 |,$$
- $$\tau_0 = \tau_2 - \tau_1.$$
This results in:
- \[r(t) = r_1(t) + k_0 \cdot r_1( t - \dew_0) \hspace{0.5cm}{\rm with} \hspace{0.5cm} r_1(t) = k_1 \cdot s( t - \tau_1)\hspace{0.05cm}.\]
The graphic illustrates the equation. With the following simplifications $k_1 = 1$ and $\tau_1 = 0$ ⇒ $r_1(t) = s(t)$ we obtain:
- \[r(t) = s(t) + k_0 \cdot s( t - \tau_0) \hspace{0.05cm}.\]
From this simplified model (without the grey-shaded block) important descriptive variables can be easily calculated:
- If you use the Displacement Law you get the transfer function
- \[H(f) = {R(f)}/{S(f)} = 1 + k_0 \cdot {\rm e}^{ - {\rm j} \hspace{0.05cm}\cdot \hspace{0.05cm}2 \pi f \hspace{0.05cm} \cdot \hspace{0.05cm} \tau_0} \hspace{0.05cm}.\]
- Through the Fourier inverse transformation one obtains the impulse response
- \[h(\tau) = 1 + k_0 \cdot \delta(\tau - \tau_0) \hspace{0.05cm}.\]
$\text{Example 1:}$ We consider a two-way channel with delay $\tau_0 = 2 \ \ \rm µ s$ and some attenuation factors $k_0$ between $0$ and $1$.
The graph shows the transfer function in terms of its absolute value in the range $\pm 1 \ \rm MHz$.
You can see from this representation:
- The transfer function $H(f)$ and also its absolute value is periodic with $1/\tau_0 = 500 \ \rm kHz$.
- This frequency period here is also the Coherence Bandwidth .
- The fluctuations around the mean value $\vert H(f) \vert = 1$ are the stronger, the larger the (relative) contribution $k_0$ of the secondary path (i.e. the echo) is.
Coherence bandwidth as a function of M
We are now modifying the two-way model in such a way that we allow more than two paths, as is the case for mobile communications.
In general, the multipath channel model is thus:
- $$ = \sum_{m = 1}^{M}\hspace{0.15cm} k_m \cdot s( t - \tau_m) \hspace{0.3cm}\Rightarrow \hspace{0.3cm} h(\tau) = \sum_{m = 1}^{M}\hspace{0.15cm} k_m \cdot \delta( \tau - \tau_m) \hspace{0.05cm}.$$
We now compare
- the two-way channel $(M = 2)$ with the parameters
- \[\tau_1 = 1\,\,{\rm µ s}\hspace{0.05cm}, \hspace{0.2cm} k_1 = 0.8\hspace{0.05cm}, \hspace{0.2cm} \tau_2 = 3\,\,{\rm µ s}\hspace{0.05cm}, \hspace{0.2cm} k_2 = 0.6\]
- and the following three-way channel $(M = 3)$:
- $$\tau_1 = 1\,\,{\rm µ s}\hspace{0.05cm}, \hspace{0.2cm} k_1 = 0.8\hspace{0.05cm}, \hspace{0.2cm} \tau_2 = 3\,\,{\rm µ s}\hspace{0.05cm}, \hspace{0.2cm} k_2 \approx 0.43\hspace{0.05cm}, $$
- $$ \tau_3 = 9\,\,{\rm µ s}\hspace{0.05cm}, \hspace{0.2cm} k_3 \approx 0.43 \hspace{0.05cm}.$$
With the selected constants, both channels have the root mean square value ${\rm E}\big [k_m^2\big ] = 1$ .
The graph shows the magnitude functions $ |H(f)|$ of both channels and the corresponding impulse responses $h(\tau)$. One can see from these graphs
- In the blue channel $(M = 2)$ the Dirac functions occur in a range of width $\Delta \tau_{\rm max} = 2 \ \rm µ s$. With the red channel $(M = 3)$ this value is four times as large: $\Delta \dew_{\rm max} = 8 \ \rm µ s$.
- As a first approximation for the yet to be defined Coherence Bandwidth $B_{\rm K}$ $1/ \Delta \tau_{\rm max}$ is often used, which may differ from the correct value by a factor of $2$ or more.
- This simple approximation, marked with an apostrophe, results for the blue channel to $B_{\rm K}\hspace{0.01cm}'= 500 \ \rm kHz$, for the red channel it is $B_{\rm K}\hspace{0.01cm}'= 125 \ \rm kHz$ which is just one fourth of the blue channel's
$\text{In general the following applies: $ 
- If the signal bandwidth $B_{\rm S} = 1/T_{\rm S}$ is much smaller than the coherence bandwidth $B_{\rm K}$, then the channel for this system can be considered non-frequency selective $(T_{\rm S}$ denotes the symbol duration$)$.
- In other words: For a given $B_{\rm S}$ the smaller the coherence bandwidth $B_{\rm K}$ or the larger the maximum delay $\Delta \tau_{\rm max}$ the greater the frequency selectivity.
- This also means: The frequency selectivity is often determined by the longest echo.# Many short echoes with a total energy $E$ are less disturbing than a long echo of the same energy $E$.
Consideration of the time variance
Up to now the attenuation factors $k_m$ were assumed to be constant. For mobile radio, however, this channel model is only correct if transmitter and receiver are static, which is merely a special case for this communication system.
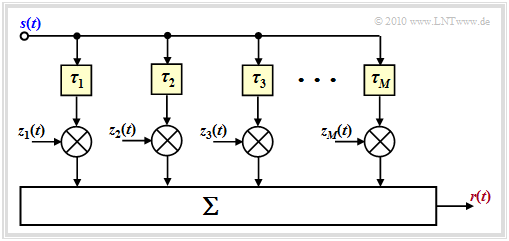
For a moving user, these constant factors $k_m$ must be replaced by the time-variant factors $z_m(t)$ which are each based on random processes. You should note this:
- The magnitudes of the complex weighting factors $z_m(t)$ are rayleighly distributed according to the page Signal characteristics with Rayleigh fading or – with line-of-sight connection – Rice distributed, as described in Signal characteristics with Rice fading .
- The bonds within the process $z_m(t)$ are related to the mobility properties (speed, direction, etc.) to the Jakes–Spectrum .
The diagram shows the generally valid model for the mobile communications channel. "Generally valid" but only with reservations, as explained at the end of the page.
For an understanding of the figure we refer to the chapter General description of the mobile communications channel. Please note:
- The $M$ main paths are characterized by large propagation time differences.
- The time-variant complex coefficients $z_m(t)$ result from the sum of many secondary paths whose delay times are all approximately the same $\tau_m$ .
$\text{Example 2:}$ Studies have shown that in mobile communications no more than four or five main pathways are effective at the same time.
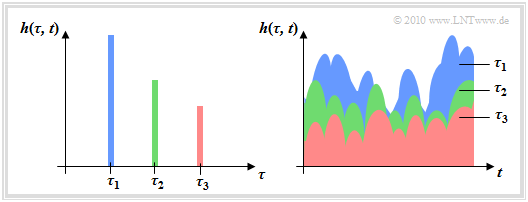
The represented 2D–impulse response $h(\tau,\hspace{0.1cm} t)$ applies to $M = 3$ main paths with time-variant behavior, where the received power decreases with increasing delay in the statistical average. For this graph the above sketched channel model is used as a basis.
Two different views are shown:
- The left image shows $h(\tau,\hspace{0.1cm} t)$ as a function of the delay time $\tau$ at a fixed time $t$.
- The viewing direction in the right image is rotated by $90^\circ$ .
- By using the color coding, the representation should be understandable.
This picture also shows the weak point of our mobile communications channel model: Although the coefficients $z_m(t)$ are variable, the delay times $\tau_m$ are fixed. This does not correspond to reality, if the mobile station is moving and the connection takes place in a changing environment. $\tau_m(t)$ should be considered.
$\text{Conclusion:}$ It is helpful to make a slight modification to the above model:
- One chooses the number $M'$ of (possible) main paths much larger than necessary and sets $\tau_m = m \cdot \delta \tau$.
- The incremental (minimum resolvable) delay $\Delta \tau = T_{\rm S}$ results from the sampling rate and thus also from the bandwidth $B_{\rm S} = 1/T_{\rm S}$ of the transmit signal.
- The maximum delay time $\tau_\text{max} = M' \cdot \delta \tau$ of this model is equal to the inverse of the coherence bandwidth $B_{\rm K}$.
- The number of paths considered is thus $M' = B_{\rm S}/B_{\rm K}$.
Here, too, usually no more than $M = 5$ main paths simultaneously provide a relevant contribution to the impulse response.
- The advantage over the first model is that for the delays now all values $\tau_m \le \tau_\text{max}$ are possible, with a temporal resolution of $\Delta \tau$ .
- Am End of GWSSUS chapter we will come back to this general model again.
Excercises to chapter
Exercise 2.2: Simple Two-Path Channel Model
Exercise 2.2Z: Real Two-Path Channel
Exercise 2.3: Yet Another Multi-Path Channel
Exercise 2.4: 2-D Transfer Function


