Contents
Description in the frequency domain
Double sideband amplitude modulation $\rm (DSB–AM)$ – both with and without a carrier – has the following characteristics:
- the modulated signal $s(t)$ requires twice the bandwidth of the source signal $q(t)$.
- The complete information about $q(t)$ is in both the upper sideband $\rm (USB)$ as well as in the lower sideband $\rm (LSB)$.
So-called single-sideband amplitude modulation $\rm (SSB–AM)$ takes advantage of this property by transmitting only one of these sidebands, either the upper sideband (USB) or the lower sideband (LSB). This reduces the required bandwidth by half compared to DSB-AM.
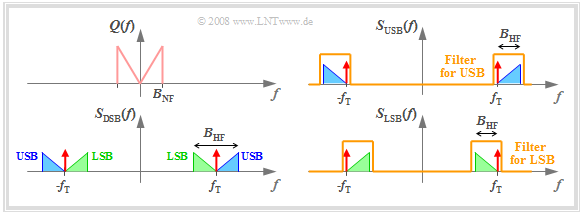
The graph illustrates single-sideband amplitude modulation in the frequency domain and simultaneously presents a realization of a SSB modulator.
In this representation, one can see:
- The SSB spectrum results from the DSB spectrum by filtering with a bandpass which displays asymmetrical behaviour with respect to the carrier frequency $f_{\rm T}$ .
- For USB modulation, the lower cutoff frequency is chosen at $f_{\rm U} = f_{\rm T} - f_ε$ and the upper cutoff frequency at $f_{\rm O} ≥ f_{\rm T} + B_{\rm NF}$ (subscripts from the German: U ⇒ "untere" i.e., lower, and O ⇒ "obere" i.e., upper). Here, $f_ε$ denotes an arbitrarily small positive frequency.
- Thus, the USB spectrum only contains the upper sideband and the carrier (though not necessarily the latter).
- To generate an USB modulation, the upper and lower cutoff frequencies of the bandpass must be set as follows:
- $$f_{\rm U} ≤ f_{\rm T} \ - \ B_{\rm NF}, \hspace{0.5cm}f_{\rm O} = f_{\rm T} + f_ε.$$
$\text{Example 1:}$ For $f_{\rm T} = 100 \ \rm kHz$ and $B_{\rm NF} = 3 \ \rm kHz$ we obtain an USB signal with carrier from the DSB signal if the filter cuts out all frequencies below $99.999\text{...} \ \rm kHz$ .
- If the lower cutoff frequency $f_{\rm U}$ is larger than $f_{\rm T}$ by an (arbitrarily) small "epsilon", we get an "USB-AM without carrier".
- A "LSB with/without carrier" can be realised accordingly, with $f_{\rm O} =100 \ \rm kHz$ and $f_{\rm O} = 99.999\text{...} \ \rm kHz$, respectively.
$\text{Example 2:}$ To save bandwidth, single-sideband technology was already used in the 1960s for the analog transmission of telephone calls.
- In accordance with a hierarchical structure, three telephone channels – each band-limited to the range from $300\ \rm Hz$ to $3.4 \ \rm kHz$ – were initially combined to form a preliminary grouping with a bandwidth of $12 \ \rm kHz$ .
- In order to be able to accommodate three channels in $12 \ \rm kHz$ with a certain safety margin, only one sideband (the lower or the upper) of each telephone channel was considered.
- Using further combinations, the long distance traffic system V10800 with up to 10800 voice channels and a total bandwidth of $60 \ \rm MHz$ was thus realized.
$\text{Conclusion:}$
- The great advantage of a SSB-AM is that it has half the bandwidth compared to DSB-AM.
- The trade-off with disadvantages required for this advantage is explained in the next pages.
Synchronous demodulation of a SSB signal
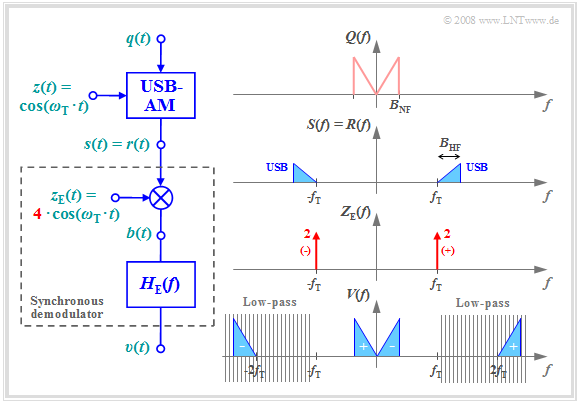
Let us now consider a SSB modulated signal and a synchronous demodulator at the receiver.
- Perfect frequency and phase synchronization will be assumed.
- Without affecting generality, in the rest of this section we will always let ${ ϕ}_{\rm T} = 0$ ⇒ cosine carrier.
A comparison with the characteristics of the synchronous demodulator for DSB-AM in the second-to-last chapter visited shows the follows similarities and differences:
- The spectrum $V(f)$ of the sink signal results in both cases from the convolution of the spectra $R(f)$ and $Z_{\rm E}(f)$, the latter being composed of two Dirac functions at $±f_{\rm T}$ .
- For SSB–AM the convolution products overlap with the left and the right Dirac function at every frequency. These are denoted by "+" and "-" respectively in the corresponding DSB–graph.
- In contrast, for USB, only the convolution with the Dirac line at $ -f_{\rm T}$ yields the $V(f)$ component for positive frequencies, and for LSB modulation it is the convolution with the Dirac function $δ(f - f_{\rm T})$.
- In the case of DSB–AM, $v(t) = q(t)$ is reached with the receiver-side carrier signal $z_{\rm E}(t) = 2 · \cos(ω_{\rm T} · t)$ . In contrast, the carrier amplitude must be increased to $A_{\rm T} = 4$ for SSB-AM.
$\text{Conclusion:}$ If there is a frequency offset between the carrier signals $z(t)$ and $z_{\rm E}(t)$, strong nonlinear distortion always occurs, i.e., regardless of whether DSB-AM or SSB-AM is present. For the implementation of a synchronous demodulator a perfect frequency synchronization is essential.
Influence of a phase offset for SSB-AM
Let us now consider the influence of a phase offset $Δ{\mathbf ϕ}_{\rm T}$ between the transmitter and receiver side carrier signals, using an example source signal
- $$q(t) = A_1 \cdot \cos(\omega_1 \cdot t ) + A_2 \cdot \cos(\omega_2 \cdot t)\hspace{0.05cm}.$$
- For DSB–AM, such a phase offset only leads to frequency-independent attenuation, but not to distortions:
- $$v(t) = \cos (\Delta \phi_{\rm T}) \cdot q(t) = \cos (\Delta \phi_{\rm T}) \cdot A_1 \cdot \cos(\omega_1 \cdot t ) + \cos (\Delta \phi_{\rm T}) \cdot A_2 \cdot \cos(\omega_2 \cdot t ) \hspace{0.05cm}.$$
- In contrast, for USB-AM, we get:
- $$v(t) = A_1 \cdot \cos(\omega_1 \cdot t - \Delta \phi_{\rm T}) + A_2 \cdot \cos(\omega_2 \cdot t - \Delta \phi_{\rm T})= A_1 \cdot \cos(\omega_1 \cdot (t - \tau_1)) + A_2 \cdot \cos(\omega_2 \cdot (t - \tau_2))\hspace{0.05cm}.$$
$\text{From this equation we can see:}$
- The two times $τ_1 = Δ{\mathbf ϕ}_{\rm T}/ω_1$ and $τ_2 = Δ{\mathbf ϕ}_{\rm T}/ω_2$ are different.
- This means that a phase offset in SSB–AM (USB–AM oder LSB–AM) leads to phase distortions (i.e., to linear distortions).
- A positive value of $Δ{\mathbf ϕ}_{\rm T}$ will cause
- positive values of $τ_1$ and $τ_2$ (i.e., lagging signals with respect to the cosine) for USB, and
- negative $τ_1$ and $τ_2$ values (leading signals) for LSB.
The effects of phase distortions on one of a message signal composed two cosine oscillations is illustrated with the interactive applet Linear distortions of periodic signals .
Sideband-to-carrier ratio
An important Parameter for DSB–AM is the modulation depth $m = q_{\rm max}/A_{\rm T}$.
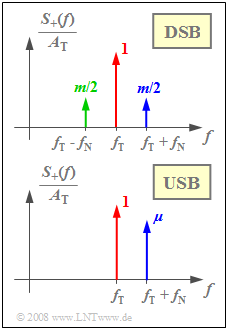
In the special case of a harmonic oscillation, $m = A_{\rm N}/A_{\rm T}$ holds and one obtains the spectrum $S_+(f)$ of the analytical signal corresponding to the upper graph. Please note the normalization with respect to $A_{\rm T}$.
Bei der ESB–AM ist die Anwendung des Parameters $m$ zwar prinzipiell möglich, aber nicht zweckmäßig. Beispielsweise gilt für die Zeitbereichsdarstellung der OSB–AM mit dem Spektrum $S_+(f)$ entsprechend der unteren Grafik:
- $$s_+(t) = A_{\rm T} \cdot {\rm e}^{{\rm j}\hspace{0.03cm}\cdot \hspace{0.05cm} \omega_{\rm T} \hspace{0.03cm}\cdot \hspace{0.05cm}t } + {A_{\rm N}}/{2} \cdot {\rm e}^{{\rm j}\hspace{0.03cm}\cdot \hspace{0.03cm} (\omega_{\rm T} + \omega_{\rm N}) \hspace{0.05cm}\cdot \hspace{0.05cm}t }\hspace{0.05cm}.$$
Hierfür kann in gleicher Weise
- $$s_+(t) = A_{\rm T} \cdot \left({\rm e}^{{\rm j}\hspace{0.03cm}\cdot \hspace{0.05cm} \omega_{\rm T} \hspace{0.03cm}\cdot \hspace{0.05cm}t } + \mu \cdot {\rm e}^{{\rm j}\hspace{0.03cm}\cdot \hspace{0.03cm} (\omega_{\rm T} + \omega_{\rm N}) \hspace{0.03cm}\cdot \hspace{0.05cm}t }\right)$$
geschrieben werden, wobei nun das Seitenband–zu–Träger–Verhältnis verwendet ist:
- $$\mu = \frac{A_{\rm N}}{2 \cdot A_{\rm T}} \hspace{0.05cm}.$$
Ist das Quellensignal keine harmonische Schwingung, so ist die Angabe dieser Größe schwierig.
- Hier kann man folgende Näherung benutzen:
- $$\mu \approx \frac{q_{\rm max}}{2 \cdot A_{\rm T}} \hspace{0.3cm}{\rm mit}\hspace{0.3cm} q_{\rm max} = \max_{t} \hspace{0.05cm} |q(t)| \hspace{0.05cm}.$$
- Somit ist $\mu \approx m/2.$ Ein Vergleich zwischen ZSB–AM und ESB-AM sollte jedoch stets für den gleichen Zahlenwert von $m$ bzw. $\mu$ erfolgen.
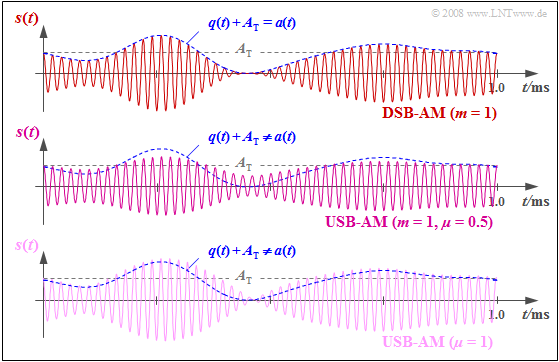
$\text{Beispiel 3:}$ Die obere Grafik zeigt das ZSB–AM–Signal für den Modulationsgrad $m = q_{\rm max}/A_{\rm T} = 1$ ⇒ Grenzfall für die Anwendung der Hüllkurvendemodulation bei ZSB-AM:
⇒ Das Nachrichtensignal $q(t)$ ist dann in der Hüllkurve $a(t)$ gerade noch verzerrungsfrei enthalten.
Für das OSB–Signal in der mittleren Grafik zeigt wurde ebenfalls $A_{\rm T} = q_{\rm max}$ gewählt, was nach obigen Definitionen den Zahlenwerten $m = 1$ bzw. $\mu = 0.5$ entspricht.
⇒ Da der USB-Beitrag fehlt, unterscheidet sich hier die Hüllkurve $a(t)$ deutlich von $q(t) + A_{\rm T}.$
Dagegen wurde für den unteren Signalverlauf $q_{\rm max} = 2 · A_{\rm T}$ gewählt.
⇒ Das Seitenband–zu–Träger–Verhältnis hat hier den Zahlenwert $\mu =1$.
Diese Grafik macht Folgendes deutlich:
- Es sind mehr Ähnlichkeiten zwischen dem oberen und dem unteren Signal festzustellen als zwischen den ersten beiden ⇒ der Vergleich zwischen einer ZSB–AM und einer ESB–AM sollte möglichst bei gleichem Zahlenwert für $m$ bzw. $\mu$ erfolgen.
- Die Hüllkurvendemodulation führt bei einer Einseitenband–Amplitudenmodulation grundsätzlich – das heißt für jeden Zahlenwert des Seitenband–zu–Träger–Verhältnisses $\mu$ – zu gravierenden Verzerrungen. Diese sind von nichtlinearer Art und somit irreversibel.
Zusammenfassende Bewertung der ESB–AM
Der entscheidende Vorteil der ESB–AM gegenüber der ZSB–AM ist der um den Faktor $2$ geringere Bandbreitenbedarf. Für die halbe Bandbreite der ESB–AM müssen aber auch Nachteile in Kauf genommen werden, die in den Aufgaben zu diesem Abschnitt untersucht werden sollen:
- Die Information über das Quellensignal $q(t)$ steckt nun im Gegensatz zur ZSB–AM nicht mehr ausschließlich in der Amplitude, sondern gleichermaßen auch in der Phase
(siehe Aufgabe 2.11). - Die Anwendung der Hüllkurvendemodulation bei OSB– oder USB–AM führt deshalb stets zu starken nichtlinearen Verzerrungen (siehe Aufgabe 2.11Z).
- Synchrondemodulation eines ESB–AM–Signals führt zu Phasenverzerrungen, wenn zwischen den Trägersignalen bei Sender und Empfänger ein Phasenversatz besteht.
Ebenso wie bei einer ZSB–AM mit Synchrondemodulation gelten auch hier folgende Aussagen:
- Dämpfungsverzerrungen des Kanals führen ebenfalls nur zu (linearen) Dämpfungsverzerrungen bezüglich des Sinkensignals. Es entstehen keine nichtlinearen Verzerrungen (siehe Aufgabe A2.10).
- Die ESB–AM ohne Träger zeigt genau gleiches Rauschverhalten wie die ZSB–AM ohne Träger. Der Vorteil der kleineren HF–Bandbreite wird durch die notwendige Pegelanpassung aufgehoben.
- Eine ESB–AM mit Seitenband–zu–Träger–Verhältnis $\mu$ zeigt ähnliches Rauschverhalten wie eine ZSB–AM mit Modulationsgrad $m = \sqrt{2} · \mu$ (siehe Aufgabe 2.10Z).
- Allerdings ist zu beachten, dass die ESB–AM mit Träger aufgrund der nichtlinearen Verzerrungen bei Hüllkurvendemodulation wenig sinnvoll ist.
Aufgaben zum Kapitel
Aufgabe 2.10: ESB-AM mit Kanalverzerrungen
Aufgabe 2.10Z: Rauschen bei ZSB-AM und ESB-AM
Aufgabe 2.11: Hüllkurvendemodulation eines ESB-Signals
Aufgabe 2.11Z: Nochmals ESB-AM und Hüllkurvendemodulator


