Exercise 2.11Z: Once again SSB-AM and Envelope Demodulator
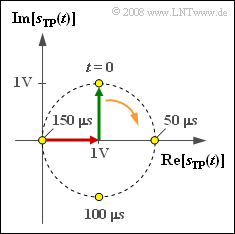
The adjacent graph shows the locus curve – i.e., the representation of the equivalent low-pass signal in the complex plane – for a SSB-AM system.
It is further given that the carrier frequency is $f_{\rm T} = 100 \ \rm kHz$ and the channel is ideal:
- $$ r(t) = s(t) \hspace{0.3cm} \Rightarrow \hspace{0.3cm} r_{\rm TP}(t) = s_{\rm TP}(t) \hspace{0.05cm}.$$
An ideal envelope demodulator $\rm (HKD)$ is used at the receiver.
The following values are used in these exercises:
- the sideband-to-carrier ratio
- $$\mu = \frac{A_{\rm N}/2}{A_{\rm T}}\hspace{0.05cm},$$
- the envelope
- $$a(t) = |s_{\rm TP}(t)| \hspace{0.05cm},$$
- the maximum deviation $τ_{\rm max}$ of the zero crossings between transmit signal $s(t)$ and the carrier signal $z(t)$.
Hints:
- This exercise belongs to the chapter Single-sideband Modulation.
- Particular reference is made to the page Sideband-to-carrier ratio.
- In this exercise, apply the same assumptions as in Exercise 2.11.
Questions
Solution
- The equivalent low-pass signal is:
- $$ s_{\rm TP}(t) = 1\,{\rm V} + {\rm j}\cdot 1\,{\rm V}\cdot {\rm e}^{-{\rm j} \hspace{0.03cm}\cdot \hspace{0.03cm}\omega_{\rm N}\cdot \hspace{0.03cm}\hspace{0.03cm}t} \hspace{0.05cm}.$$
- The locus curve is a circle with its center at $A_{\rm T} = 1 \ \rm V$.
- Since the rotation is clockwise, we are dealing with a LSB-AM.
- The rotating (green) pointer points towards the start time $t = 0$ in the direction of the imaginary axis.
- It follows that the source signal is characterized by: $q(t) = A_{\rm N} \cdot \sin(\omega_{\rm N} \cdot t).$
(2) For the LSB, only the lower sideband is transmitted, with pointer length $A_{\rm N}/2 = 1 \ \rm V$ .
- This results in $A_{\rm N}\hspace{0.15cm}\underline { = 2 \ \rm V}$.
- For one revolution in the locus, the pointer needs the time $200 \ \rm µ s$.
- The reciprocal of this is the frequency $f_{\rm N}\hspace{0.15cm}\underline { = 5 \ \rm kHz}$.
(3) According to the definition on the exercise page and the results in subtasks (1) and (2) , the following holds:
- $$ \mu = \frac{A_{\rm N}/2}{A_{\rm T}}\hspace{0.15cm}\underline {= 1}\hspace{0.05cm}.$$
- Thus, the equivalent low-pass signal can also be written as:
- $$s_{\rm TP}(t) = A_{\rm T} \cdot \left( 1 + {\rm j} \cdot \mu \cdot {\rm e}^{-{\rm j} \hspace{0.03cm}\cdot \hspace{0.03cm}\omega_{\rm N}\cdot \hspace{0.03cm}\hspace{0.03cm}t} \right),\hspace{0.3cm}{\rm hier}\hspace{0.15cm}\mu = 1 \hspace{0.05cm}.$$
(4) Splitting the complex exponential function into real and imaginary parts using Euler's theorem, we get:
- $$s_{\rm TP}(t) = A_{\rm T} \cdot \big( 1 + \sin(\omega_{\rm N}\cdot t) + {\rm j} \cos(\omega_{\rm N}\cdot t)\big) \hspace{0.05cm}.$$
- By applying the "Pythagorean Theorem", this can also be written as:
- $$a(t) = |s_{\rm TP}(t)| = A_{\rm T} \cdot \sqrt{ (1 + \sin(\omega_{\rm N}\cdot t))^2 + \cos^2(\omega_{\rm N}\cdot t)} = A_{\rm T} \cdot \sqrt{ 2 + 2 \cdot \sin(2\omega_{\rm N}\cdot t)} \hspace{0.05cm}.$$
- The retrieved values when $A_{\rm T} = 1\ \rm V$ are:
- $$ a(t = 50\,{\rm µ s}) \hspace{0.15cm}\underline {= 2\,{\rm V}},\hspace{0.3cm}a(t = 100\,{\rm µ s}) \hspace{0.15cm}\underline {= 1.414\,{\rm V}},\hspace{0.3cm}a(t = 150\,{\rm µ s}) \hspace{0.15cm}\underline {= 0} \hspace{0.05cm}.$$
- These results can be directly read off the graph on the exercise page.
(5) A hint for the location of the zero crossings of $s(t)$ with respect to the grid given by the carrier signal $z(t)$ is provided by the phase function $ϕ(t)$.
- For the given locus, these can take on values between $±π/2\ (±90^\circ)$ .
- For example, these maximum values arise in the region around $t ≈ 150 \ \rm µ s$ , since a phase jump occurs there.
- The relationship between $τ_{\rm max}$ and $\Delta ϕ_{\rm max}$ is:
- $$ \tau_{\rm max} = \frac {\Delta \phi_{\rm max}}{2 \pi }\cdot \frac{1 }{f_{\rm T}} = \frac {1}{4}\cdot 10\,{\rm µ s} \hspace{0.15cm}\underline {= 2.5\,{\rmµ s}} \hspace{0.05cm}.$$
