Exercise 3.1: Phase Modulation Locus Curve
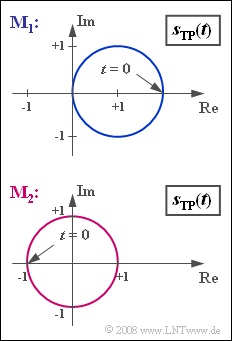
The locus curve is generally understood as the plot of the equivalent low-pass signal $s_{\rm TP}(t)$ in the complex plane.
- The graph shows locus curves at the output of two modulators $\rm M_1$ and $\rm M_2$.
- The real and imaginary parts are each normalized to $1 \ \rm V$ in this graph.
Let the source signal be the same for both modulators:
$$ q(t) = A_{\rm N} \cdot \cos(2 \pi f_{\rm N} \cdot t),\hspace{1cm}
{\rm with}\hspace{0.2cm} A_{\rm N} = 2\,{\rm V},\hspace{0.2cm}f_{\rm N} = 5\,{\rm kHz}\hspace{0.05cm}.$$
One of the two modulators implements phase modulation, which is characterized by the following equations:
- $$ s(t) = A_{\rm T} \cdot \cos \hspace{-0.1cm} \big[\omega_{\rm T} \cdot t + \phi(t) \big]\hspace{0.05cm},$$
- $$ s_{\rm TP}(t) = A_{\rm T} \cdot {\rm e}^{\hspace{0.05cm}{\rm j} \hspace{0.05cm}\cdot \hspace{0.05cm}\phi(t) }\hspace{0.05cm},$$
- $$ \phi(t) = K_{\rm PM} \cdot q(t)\hspace{0.05cm}.$$
The maximum value $ϕ(t)$ is called the modulation index $η$. Often $η$ is also called phase deviation in the literature.
Hints:
- This exercise belongs to the chapter Phase Modulation.
- Particular reference is made to the page Equivalent low-pass signal in phase modulation.
Questions
Solution
- If one moves in the mathematically positive direction on the circle, it is specifically an USB–AM, otherwise it is a LSB–AM.
- The phase function $ϕ(t)$ as the angle of a point $s_{\rm TP}(t)$ on the circle (arc) with respect to the coordinate origin can take values between $±π/2$ and does not show a cosine progression.
- The envelope $a(t) = |s_{\rm TP}(t)|$ is also not cosine.
- If an envelope demodulator were used for $\rm M_1$ at the receiver, nonlinear distortions would occur, in contrast to DSB–AM, which has a horizontal straight line for a locus curve.
(2) Here, we observe phase modulation ⇒ Answer 3:
- The envelope $a(t) = A_{\rm T}$ is constant,
- while the phase $ϕ(t)$ is cosinusoidal according to the source signal $q(t)$ .
(3) In the case of phase modulation:
- $$s_{\rm TP}(t) = A_{\rm T} \cdot {\rm e}^{\hspace{0.05cm}{\rm j} \hspace{0.05cm}\cdot \hspace{0.05cm}\phi(t) }\hspace{0.05cm}.$$
- From the graph, we can read the carrier amplitude $A_{\rm T}\hspace{0.15cm}\underline{ = 1 \ \rm V}$ as the radius of the circle.
(4) The source signal $q(t)$ is at its maximum at time $t = 0$ and therefore so is the phase function:
- $$ \eta = \phi_{\rm max} = \phi( t =0) = \pi\hspace{0.15cm}\underline { = 3.1415} \hspace{0.05cm}.$$
- This gives the modulator constant:
$$K_{\rm PM} = \frac{\eta}{A_{\rm N}} = \frac{\pi}{2\,{\rm V}}\hspace{0.15cm}\underline {= 1.571\,{\rm V}^{-1}}\hspace{0.05cm}.$$
(5) One moves clockwise along the circular arc:
- After a quarter of the period $T_{\rm N} = 1/f_{\rm N} = 200 \ \rm µ s$ , $ϕ(t) = 0$ and $s_{\rm TP}(t) = 1 \, \rm V$.
- At time $t_1 = T_{\rm N}/2\hspace{0.15cm}\underline { = 100 \ \rm µ s}$ , $ϕ(t_1) = -π$ and $s_{\rm TP}(t_1) = -1 \, \rm V$.
- Afterwards, move counterclockwise along the arc.
