Contents
Prerequisites and optimization criterion
The following block diagram applies to this chapter "Optimization of Baseband Transmission Systems":
Unless explicitly stated otherwise, the following prerequisites are assumed in the following:
- The transmission is binary, bipolar and redundancy-free. The distance between symbols is $T$ and the (equivalent) bit rate $R = 1/T$. Multilevel and/or redundant systems are not discussed until the main chapter 2: Coded and Multilevel Transmission of this book.
- The basic transmission pulse $g_s(t)$ is rectangular and has the amplitude $s_0$ and the pulse duration $T_{\rm S} \le T$. If the transmission pulse duration $T_{\rm S}$ coincides with the symbol duration $T$, we speak of NRZ rectangular pulses. In the case $T_{\rm S} < T$ a RZ format is present.
- The AWGN model with the (one-sided) noise power density $N_0$ is used as the transmission channel, so that $r(t) = s(t) + n(t)$ applies to the received signal. The two-sided noise power density more suitable for system-theoretical investigations is thus $N_0/2$.
- Let the impulse response $h_{\rm E}(t)$ of the receiver filter also be rectangular, but with width $T_{\rm E}$ and height $1/T_{\rm E}$. The equal signal transfer factor is therefore $H_{\rm E}(f = 0) = 1$. Only in the special case $T_{\rm E} = T_{\rm S} $ can $H_{\rm E}(f)$ be called a matched filter.
- In order to exclude intersymbol interfering, the constraint $T_{\rm S} + T_{\rm E} \le 2T$ must always be observed during optimization. Intersymbol interfering will not be considered until the main chapter 3: Intersymbol Interfering and Equalization Methods of this book.
- To obtain the sink symbol sequence, we use a simple threshold decision with optimal decision threshold $E = 0$ and optimal detection times $($under the given conditions at $\nu \cdot T)$.
$\text{Definition:}$ By system optimization we mean here to determine the parameters $T_{\rm S}$ and $T_{\rm E}$ of the basic transmission pulse $g_s(t)$ and the receiver filter impulse response $h_{\rm E}(t)$ in such a way that the bit error probability $p_{\rm B}$ assumes the smallest possible value.
Power and peak limitation
The optimization of the system variables is decisively influenced by whether
power limitation or peak limitation of the transmission signal is required as a constraint of the optimization.
$\text{Definition:}$ Power limitation means that the (average) transmission power $P_{\rm S}$ must not exceed a specified maximum value $P_\text{S, max}$:
- $$P_{\rm S}= {\rm E}[s(t)^2] = \overline{s(t)^2} \le P_{\rm S,\hspace{0.05cm} max}\hspace{0.05cm}.$$
In order to achieve the minimum error probability, one will naturally choose the average transmission power $P_{\rm S}$ as large as possible in the allowed range. Therefore, $P_{\rm S} = P_\text{S, max}$ is always set in the following.
The question of whether power limitation can actually be assumed as a secondary condition of optimization depends on the technical boundary conditions. This assumption is especially justified for radio transmission systems, among other things because the impairment of humans and animals known as "electrosmog" depends to a large extent on the (average) radiated power.
However, the description variables defined here using baseband transmission as an example are modified in the main chapter 4: Generalized Description of Digital Modulation Methods of this book to the effect that they are also applicable to digital carrier frequency systems.
$\text{Definition:}$ Peak value limitation is always referred to when the output range of the transmission device is limited. For bipolar signaling, the corresponding condition is:
- $$\vert s(t) \vert \le s_0\hspace{0.4cm}{\rm{for} }\hspace{0.15cm}{\rm all}\hspace{0.15cm}t.$$
Often, instead of peak limitation, the term amplitude limitation is also used, but this does not quite reflect the facts.
Of course, peak limiting also limits the power, but not the average power, but the peak power.
The secondary condition "peak limitation" is useful and even necessary, for example, if
- the output power range of the transmitter is limited due to nonlinearities of components and power amplifiers, or
- the crosstalk noise must not exceed a limit value at any time. This is especially important when communicating over two-wire lines.
$\text{Example 1:}$ We consider here three different constellations. Let the basic transmission pulse $g_s(t)$ and the receiver filter impulse response $h_{\rm E}(t)$ each be rectangular and the amplitude $g_0$ of the output pulse always coincide with the input pulse amplitude $s_0$.
$\text{System A}$ $(T_{\rm S} = T, \ T_{\rm E} = T)$:
- NRZ basic transmission pulse,
- Matched filter, since $T_{\rm E} = T_{\rm S}$,
- Basic detection pulse: triangle,
- Energy per bit: $E_{\rm B} = s_0^2 \cdot T$,
- Noise power: $\sigma_d^2 = N_0/(2T)$,
- Best possible constellation
- Bit error probability: $p_{\rm B}\hspace{-0.01cm} =\hspace{-0.01cm}{\rm Q} \left( g_0/\sigma_d\right)$
- $$\Rightarrow \hspace{0.3cm}p_{\rm B}= {\rm Q} \left( \sqrt{ {2 \cdot s_0^2 \cdot T}/{N_0} }\right) = {\rm Q} \left( \sqrt{ {2 \cdot E_{\rm B} }/{N_0} }\right)\hspace{0.05cm}.$$
$\text{System B}$ $(T_{\rm S} = T, \ T_{\rm E} = T/2)$:
- NRZ basic transmission pulse,
- No matched filter, since $T_{\rm E} \ne T_{\rm S}$,
- Basic detection pulse: triangle,
- Energy per bit: $E_{\rm B} = s_0^2 \cdot T$,
- Noise power: $\sigma_d^2 = N_0/T$,
- always $\text{3 dB}$ worse than $\text{System A}$
- Bit error probability: $p_{\rm B}\hspace{-0.01cm} =\hspace{-0.01cm}{\rm Q} \left( g_0/\sigma_d\right)$
- $$\Rightarrow \hspace{0.3cm}p_{\rm B}= {\rm Q} \left( \sqrt{ {s_0^2 \cdot T}/{N_0} }\right) = {\rm Q} \left( \sqrt{ E_{\rm B} /{N_0} }\right)\hspace{0.05cm}.$$
$\text{System C}$ $(T_{\rm S} = T/2, \ T_{\rm E} = T/2)$:
- RZ basic transmission pulse,
- Matched filter, since $T_{\rm E} = T_{\rm S}$,
- Basic detection pulse: smaller triangle,
- Energy per bit: $E_{\rm B} = 1/2 \cdot s_0^2 \cdot T$,
- Noise power: $\sigma_d^2 = N_0/T$,
- with power limitation equivalent to $\text{System A}$,
- at peak limitation $\text{3 dB}$ worse than $\text{System A}$,
- Bit error probability: $p_{\rm B}\hspace{-0.01cm} =\hspace{-0.01cm}{\rm Q} \left( g_0/\sigma_d\right)$
- $$\Rightarrow \hspace{0.3cm}p_{\rm B} = {\rm Q} \left( \sqrt{ { s_0^2 \cdot T}/{N_0} }\right)= {\rm Q} \left( \sqrt{2 \cdot {E_{\rm B} }/{N_0} }\right)\hspace{0.05cm}.$$
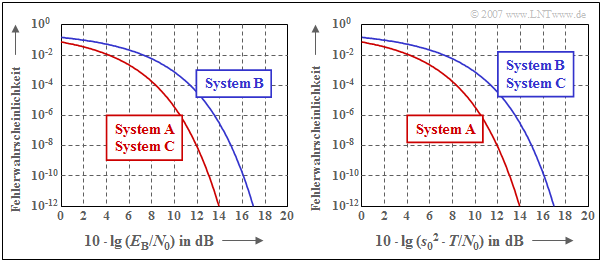
$\text{Example 2:}$ Same conditions as in $\text{Example 1}$ apply.
The diagram shows the bit error probability $p_{\rm B}$
- as a function of the ratio $E_{\rm B}/N_0$ (left diagram) and
- as a function of $s_0^2 \cdot T /N_0$ (right diagram).
Graphically shown are the results derived in $\text{Example 1}$.
These two diagrams in double logarithmic representation are to be interpreted as follows:
- The left diagram compares the systems at the same average power $(P_{\rm S})$ and at constant energy per bit $(E_{\rm B})$, respectively. Since the abscissa value is additionally related to $N_0$, $p_{\rm B}(E_{\rm B}/N_0)$ correctly reflects the situation even for different noise power densities $N_0$.
- When power is limited, configurations $\rm A$ and $\rm C$ are equivalent and represent the optimum in each case. As will be shown on the next pages, an optimal system with power limitation always exists if $g_s(t)$ and $h_{\rm E}(t)$ have the same shape (matched filter). The smaller power of system $\rm C$ is compensated by the abscissa chosen here.
- In contrast, for system $\rm B$ the matched filter condition is not met $(T_{\rm E} \ne T_{\rm S})$ and the error probability curve is now $\text{3 dB}$ to the right of the boundary curve given by systems $\rm A$ and $\rm C$.
- The diagram on the right describes the optimization result with peak limitation, which can be seen from the abscissa labeling. The curve $\rm A$ (NRZ pulse, matched filter) also indicates here the limit curve, which cannot be undershot by any other system.
- Curve $\rm B$ in the diagram on the right has exactly the same shape as in the diagram on the left, since NRZ transmission pulses are again used. The distance of $\text{3 dB}$ from the limit curve is again due to non-compliance with the matched filter condition.
- In contrast to the left diagram, the matched filter system $\rm C$ is now also $\text{3 dB}$ to the right of the optimum. The reason for this degradation is that for the same peak value (same peak power), system $\rm C$ provides only half the average power as system $\rm A$.
System optimization with power limitation
The minimization of the bit error probability $p_{\rm B} = {\rm Q} \left( \sqrt{\rho_d}\right)$ can be attributed to the maximization of the signal–to–noise power ratio $\rho_d$ before the threshold decision (in short: detection SNR) due to the monotonic function progression of the complementary Gaussian error function $ {\rm Q}(x)$:
- $$p_{\rm B} = {\rm Q} \left( \sqrt{\rho_d}\right)\hspace{0.3cm}\Rightarrow \hspace{0.3cm}{\rm Minimum}\hspace{0.8cm}\Rightarrow \hspace{0.8cm}\rho_d ={g_0^2}/{\sigma_d^2}\hspace{0.3cm}\Rightarrow \hspace{0.3cm}{\rm Maximum}\hspace{0.05cm}.$$
Here, $g_0 = g_d(t=0)$ indicates the amplitude of the considered Nyquist pulse and $\sigma_d^2$ denotes the detection noise power for the given receiver filter. At the same time it must be ensured that
- the basic transmitter pulse $g_d(t) = g_s(t) \star h_{\rm E}(t)$ satisfies the first Nyquist criterion, and
- the energy of the basic transmission pulse $g_s(t)$ does not exceed a predetermined value $E_{\rm B}$.
In the previous sections, it has been mentioned several times that for the AWGN channel with the (one-sided) noise power density $N_0$, the following holds for the optimal system under the constraint of power limitation:
- $$p_{\rm B, \hspace{0.08cm}min} = {\rm Q} \left( \sqrt{\rho_{d, \hspace{0.05cm}{\rm max \hspace{0.05cm} | \hspace{0.05cm} L}}}\right)\hspace{0.5cm}{\rm with}\hspace{0.5cm} \rho_{d, \hspace{0.05cm}{\rm max \hspace{0.05cm} | \hspace{0.05cm} L}}={2 \cdot E_{\rm B}}/{N_0}\hspace{0.05cm}.$$
We use this result for the following definition:
$\text{Definition:}$ The system efficiency under power limitation of a given configuration is the quotient of the actual and the highest possible signal–to–noise power ratio at the decision (detection SNR ):
- $$\eta_{\rm L} = \frac{\rho_d}{\rho_{d, \hspace{0.05cm}{\rm max \hspace{0.05cm}\vert \hspace{0.05cm} L} } }= \frac{g_0^2 /\sigma_d^2}{2 \cdot E_{\rm B}/N_0}\hspace{0.05cm}.$$
In the following it is proved that
- the quantity thus defined actually satisfies the condition $0 \le \eta_{\rm L} \le 1$ and thus can be interpreted as "efficiency",
- the value $\eta_{\rm L} = 1$ is obtained when the receiver filter impulse response $h_{\rm E}(t)$ is equal in shape to the basic transmission pulse $g_s(t)$&.nbsp;
$\text{Proof:}$ The proof is done in the frequency domain. For presentation reasons, we normalize the basic transmission pulse:
- $$h_{\rm S}(t) = \frac{g_s(t)}{g_0 \cdot T} \hspace{0.4cm}\circ\!\!-\!\!\!-\!\!\!-\!\!\bullet \hspace{0.4cm} H_{\rm S}(f) = \frac{G_s(f)}{g_0 \cdot T} \hspace{0.05cm}.$$
Thus $h_{\rm S}(t)$ has the unit "$\rm 1/s$" and $H_{\rm S}(f)$ is dimensionless. For the individual system quantities it follows:
(1) Due to the first Nyquist criterion, it must hold:
- $$ G_d(f) = G_s(f) \cdot H_{\rm E}(f) = G_{\rm Nyq}(f) \hspace{0.3cm} \Rightarrow \hspace{0.3cm} H_{\rm S}(f) \cdot H_{\rm E}(f)= H_{\rm Nyq}(f)= \frac{G_{\rm Nyq}(f)}{g_0 \cdot T}\hspace{0.05cm}.$$
(2) The amplitude of the basic transmitter pulse is equal to
- $$g_d(t=0) = g_0 \cdot T \cdot \int_{-\infty}^{+\infty}H_{\rm Nyq}(f) \,{\rm d} f = g_0\hspace{0.05cm}.$$
(3) The energy of the basic transmission pulse is given as follows:
- $$E_{\rm B} = g_0^2 \cdot T^2 \cdot \int_{-\infty}^{+\infty} \vert H_{\rm S}(f)\vert ^2 \,{\rm d} f \hspace{0.05cm}.$$
(4) The detection noise power is:
- $$ \sigma_d^2 = \frac{N_0}{2} \cdot \int_{-\infty}^{+\infty} \vert H_{\rm E}(f) \vert^2 \,{\rm d} f = \frac{N_0}{2} \cdot \int_{-\infty}^{+\infty}\frac {\vert H_{\rm Nyq}(f) \vert^2}{\vert H_{\rm S}(f) \vert^2} \,{\rm d} f\hspace{0.05cm}. $$
(5) Substituting these partial results into the equation for the system efficiency, we obtain:
- $$\eta_{\rm L} = \left [ {T \cdot \int_{-\infty}^{+\infty} \vert H_{\rm S}(f) \vert^2 \,{\rm d} f \hspace{0.2cm} \cdot \hspace{0.2cm}T \cdot \int_{-\infty}^{+\infty}\frac { \vert H_{\rm Nyq}(f) \vert ^2}{ \vert H_{\rm S}(f) \vert^2} \,{\rm d} f } \right ]^{-1}\hspace{0.05cm}.$$
(6) We now apply Schwartz's inequality [BS01][1] to the expression in the parenthesis:
- $$\frac{1}{\eta_{\rm L} } = T \cdot \int_{-\infty}^{+\infty} \vert H_{\rm 1}(f) \vert^2 \,{\rm d} f \hspace{0.2cm} \cdot \hspace{0.2cm} T \cdot \int_{-\infty}^{+\infty} \vert H_{\rm 2}(f) \vert^2 \,{\rm d} f \hspace{0.3cm}\ge\hspace{0.3cm} \left [ T \cdot \int_{-\infty}^{+\infty} \vert H_{\rm 1}(f) \cdot H_{\rm 2}(f) \vert \,{\rm d} f \right ]^2$$
- $$\Rightarrow \hspace{0.3cm}\frac{1}{\eta_{\rm L} } = T \cdot \int_{-\infty}^{+\infty} \vert H_{\rm S}(f) \vert^2 \,{\rm d} f \hspace{0.1cm} \cdot \hspace{0.1cm} T \cdot \int_{-\infty}^{+\infty}\frac { \vert H_{\rm Nyq}(f) \vert ^2}{ \vert H_{\rm S}(f) \vert ^2} \,{\rm d} f \hspace{0.2cm}\ge\hspace{0.2cm} \left [ T \cdot \int_{-\infty}^{+\infty}\hspace{-0.5cm}H_{\rm Nyq}(f) \,{\rm d} f \right ]^2 = 1. $$
(7) Thus, it is shown that the system efficiency under power limitation indeed satisfies the condition $\eta_{\rm L} \le 1$.
(8) The evaluation shows that for $H_{\rm S, \hspace{0.08cm}opt}(f) = \gamma \cdot \sqrt{H_{\rm Nyq}(f)}$ in the above inequality, the equal sign holds:
- $$\gamma^2 \cdot T \cdot \int_{-\infty}^{+\infty}\hspace{-0.3cm} H_{\rm Nyq}(f) \,{\rm d} f \hspace{0.2cm} \cdot \hspace{0.2cm} \frac {1}{\gamma^2} \cdot T \cdot \int_{-\infty}^{+\infty} \hspace{-0.3cm}H_{\rm Nyq}(f) \,{\rm d} f = \left [ T \cdot \int_{-\infty}^{+\infty}\hspace{-0.3cm}H_{\rm Nyq}(f) \,{\rm d} f \right ]^2 = 1 \hspace{0.3cm} \Rightarrow \hspace{0.3cm} \eta_{\rm L} = 1 \hspace{0.05cm}.$$
(9) This result is independent of the parameter $\gamma$, which we therefore simplify to $\gamma = 1$: $H_{\rm S, \hspace{0.08cm}opt}(f) = \sqrt{H_{\rm Nyq}(f)}$.
Root Nyquist systems
The main result of the calculations on the last sections was that for the optimal binary system under the constraint of power limitation
- the basic transmitter pulse $g_d(t) = g_s(t) \star h_{\rm E}(t)$ must satisfy the first Nyquist condition, and
- the impulse response $h_{\rm E}(t)$ of the receiver filter must be chosen to be equal in shape to the basic transmission pulse $g_s(t)$; the same applies to the spectral functions $H_{\rm E}(f)$ and $G_s(f)$.
If both $g_s(t)$ and $h_{\rm E}(t)$ are rectangular with $T_{\rm S} = T_{\rm E} \le T$, both conditions are satisfied.
- However, the disadvantage of this configuration is the large bandwidth requirement due to the slowly decaying $\rm si$–shaped spectral functions $G_s(f)$ and $H_{\rm E}(f)$.
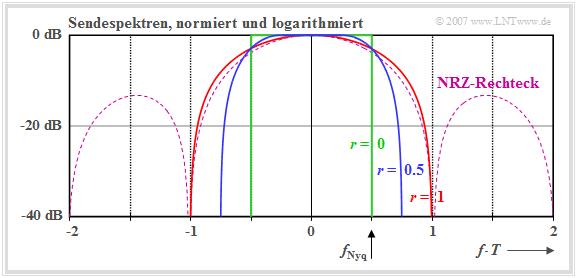
- In the diagram below, the spectral function of the rectangular NRZ basic transmission pulse is plotted as a dashed purple curve.
Assuming a Nyquist spectrum with cosine rolloff slope ⇒ $H_{\rm E}(f) = H_{\rm CRO}(f)$ aus,
- $$G_d(f) = G_s(f) \cdot H_{\rm E}(f) = g_0 \cdot T \cdot {H_{\rm CRO}(f)} \hspace{0.3cm} \Rightarrow \hspace{0.3cm}G_s(f) = g_0 \cdot T \cdot \sqrt{H_{\rm CRO}(f)},\hspace{0.5cm}H_{\rm E}(f)= \sqrt{H_{\rm CRO}(f)}\hspace{0.05cm},$$
then for each rolloff factor $r$, more favorable spectral characteristics and lower bandwidth requirements result.
The following diagram shows the normalized transmission spectra $G_s(f)/(g_0 \cdot T)$ in logarithmic representation for the three rolloff factors.
- $r = 0$ (green curve),
- $r = 0.5$ (blue curve), and
- $r = 1$ (red curve).
Notes:
- For baseband transmission, the bandwidth requirement plays only a minor role.
- However, the diagram also applies to carrier frequency systems when displayed in the equivalent lowpass range.
- In these systems, bandwidth plays a very important role. Because: Every additional hertz of bandwidth can be very expensive.
System optimization with peak limitation
For the AWGN channel with the (one-sided) noise power density $N_0$, the system optimization depends to a large extent on which constraint is specified:
- In the case of power limitation (indicated by the index "L"), the energy of the basic transmission pulse $g_s(t)$ must not exceed a specified value $E_{\rm B}$. Here, the following applies to the minimum bit error probability and the maximum SNR:
- $$p_{\rm B, \hspace{0.08cm}min} = {\rm Q} \left( \sqrt{\rho_{d, \hspace{0.05cm}{\rm max \hspace{0.05cm} | \hspace{0.05cm} L}}}\right)\hspace{0.5cm}{\rm with}\hspace{0.5cm} \rho_{d, \hspace{0.05cm}{\rm max \hspace{0.05cm} | \hspace{0.05cm} L}}={2 \cdot E_{\rm B}}/{N_0}\hspace{0.05cm}.$$
- In the case of peak limitation (or amplitude limitation, indicated by the index "A"), on the other hand, the modulation range of the transmission device is limited ⇒ $\vert s(t) \vert \le s_0\hspace{0.4cm}{\rm{for} }\hspace{0.15cm}{\rm all}\hspace{0.15cm}t$. Here, the following applies to the corresponding quantities:
- $$p_{\rm B, \hspace{0.08cm}min} = {\rm Q} \left( \sqrt{\rho_{d, \hspace{0.05cm}{\rm max \hspace{0.05cm} | \hspace{0.05cm}A}}}\right)\hspace{0.5cm}{\rm with}\hspace{0.5cm} \rho_{d, \hspace{0.05cm}{\rm max \hspace{0.05cm} | \hspace{0.05cm}A}}={2 \cdot s_0^2 \cdot T}/{N_0}\hspace{0.05cm}.$$
For this second case, we define:
$\text{Definition:}$ The system efficiency under amplitude limitation (peak limitation) is:
- $$\eta_{\rm A} = \frac{\rho_d}{\rho_{d, \hspace{0.05cm}{\rm max \hspace{0.05cm}\vert \hspace{0.05cm} A} } }= \frac{g_0^2 /\sigma_d^2}{ 2 \cdot s_0^2 \cdot T/N_0}\hspace{0.05cm}.$$
- This system efficiency also satisfies the condition $0 \le \eta_{\rm A} \le 1$.
- There is only one system with the result $\eta_{\rm A} = 1$: The NRZ rectangular basic transmission pulse and the receiver filter matched to it..
A comparison with the system efficiency under power limitation ⇒ $\eta_{\rm L}$ shows:
- $\eta_{\rm A}$ differs from $\eta_{\rm L}$ in that now the denominator contains $s_0^2 \cdot T$ instead of $E_{\rm B}$. The following relationship holds:
- $$\eta_{\rm A} = \frac{E_{\rm B}}{s_0^2 \cdot T} \cdot \eta_{\rm L}= \frac{\eta_{\rm L}}{C_{\rm S}^2}\hspace{0.05cm}.$$
- Here, the crest factor $C_{\rm S}$ denotes the ratio of the maximum value $s_0$ and the rms value $s_{\rm eff}$ of the transmitted signal:
- $$C_{\rm S} = \frac{s_0}{\sqrt{E_{\rm B}/T}} = \frac{{\rm Max}[s(t)]}{\sqrt{{\rm E}[s^2(t)]}}= \frac{s_0}{s_{\rm eff}} \hspace{0.3cm} \Rightarrow \hspace{0.3cm} s_{\rm eff} = \sqrt {E_{\rm B}/T}.$$
$\text{Example 3:}$ As in $\text{Example 1}$ we consider three different configurations, each with rectangular time functions $g_s(t)$ and $h_{\rm E}(t)$, and give the system efficiencies for each:
- $\text{System A:}$ $\rho_d = {2 \cdot E_{\rm B} }/{N_0} = { 2 \cdot s_0^2 \cdot T}/{N_0}\hspace{0.3cm}\Rightarrow \hspace{0.3cm}\eta_{\rm L} = 1.0,\hspace{0.3cm}\eta_{\rm A} = 1.0\hspace{0.05cm}.$
- $\text{System B:}$ $\rho_d = {E_{\rm B} }/{N_0} ={ s_0^2 \cdot T}/{N_0}\hspace{1.35cm}\Rightarrow \hspace{0.3cm}\eta_{\rm L} = 0.5,\hspace{0.3cm}\eta_{\rm A} = 0.5\hspace{0.05cm}.$
- $\text{System C:}$ $\rho_d = {2 \cdot E_{\rm B} }/{N_0} = { s_0^2 \cdot T}/{N_0}\hspace{0.8cm}\Rightarrow \hspace{0.3cm}\eta_{\rm L} = 1.0,\hspace{0.3cm}\eta_{\rm A} = 0.5\hspace{0.05cm}.$
It can be seen:
- For $\text{System B}$, both system efficiencies are only $0.5$ each due to the lack of matching $(T_{\rm E} \ne T_{\rm S})$.
- For $\text{System C}$ the system efficiency $\eta_{\rm L}$ has the maximum value $\eta_{\rm L} = 1$ because of $T_{\rm E} = T_{\rm S}$.
- In contrast, $\eta_{\rm A} = 0.5$ because the RZ pulse does not have the maximum energy that would be allowed due to the peak limitation.
- The crest factor here has the value $C_{\rm S} = \sqrt{2}$.
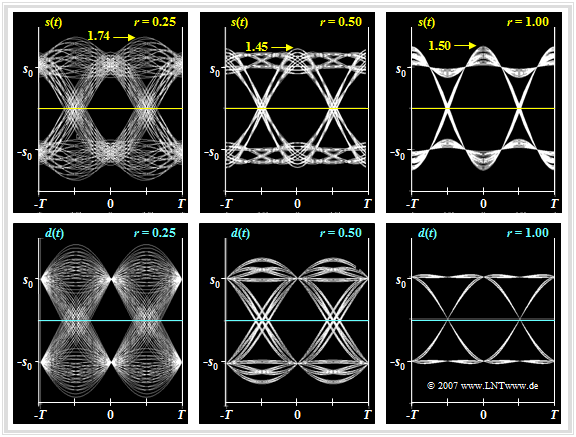
$\text{Example 4:}$ Now we consider a [Digital_Signal_Transmission/Optimization_of_Baseband_Transmission_Systems#Root_Nyquist_systems root Nyquist configuration] with cosine rolloff total frequency response:
- $$G_s(f) = g_0 \cdot T \cdot \sqrt{H_{\rm CRO}(f)},\hspace{0.5cm}H_{\rm E}(f)= \sqrt{H_{\rm CRO}(f)} \hspace{0.3cm} \Rightarrow \hspace{0.3cm} G_d(f) = g_0 \cdot T \cdot {H_{\rm CRO}(f)} = G_{\rm Nyq}(f)\hspace{0.05cm}.$$
The diagram shows the eye diagrams at the transmitter (top) and at the receiver (bottom), respectively for rolloff factors $r = 0.25$, $r = 0.5$ and $r = 0.1$. Recall that such a configuration is optimal under the constraint of power limitation independent of the rolloff factor $r$: $\eta_{\rm L} = 1$.
One can see from this plot:
- The transmission pulse $g_s(t)$ does not fulfill the Nyquist condition: The eye at the transmitter (upper row of figures) is not fully open and the maximum value of the transmitted signal is larger than its rms value.
- The crest factor $C_{\rm S} = s_0/s_{\rm eff}$ becomes larger with smaller $r$ and thus the efficiency $\eta_{\rm A} $ becomes smaller. For $r = 0.5$, the result is $C_{\rm S} \approx 1.45$ and thus $\eta_{\rm A} \approx 0.47$. The detection SNR is then lower by the amount $10 \cdot \lg \ \eta_{\rm A} \approx 3.2 \ \rm dB$ than for the square–wave–rectangular configuration.
- In the limiting case $r = 0$, even $C_{\rm S} \to \infty$ and $\eta_{\rm A} \to 0$. Here, the basic transmission pulse $g_s(t)$ decays even slower than with $1/t$, and it holds:
- $$\max_t\{ s(t) \} = \max_t \hspace{0.15cm}\left [ \sum_{(\nu)} a_\nu \cdot g_s ( t - \nu \cdot T)\ \right ]\rightarrow \infty\hspace{0.05cm}.$$
- Limiting the transmitted signal $s(t)$ to a finite maximum value $s_0$ by a weighting factor approaching zero leads to a closed eye in front of the decision.
Optimization of the rolloff factor with peak limitation
For this chapter, the following assumptions are made:
- Let the basic transmission pulse $g_s(t)$ be NRZ rectangular; with peak limitation this is optimal.
- The overall frequency response $H_{\rm S}(f) \cdot H_{\rm E}(f) =\sqrt{H_{\rm Nyq}(f)}$ satisfy the Nyquist condition.
- The Nyquist frequency response is realized by a cosine rolloff lowpass: $H_{\rm Nyq}(f) = H_{\rm CRO}(f)$.
- Since the pulse amplitude $g_0$ is independent of the rolloff factor $r$, the SNR maximization can be attributed to the minimization of the noise power at the decision:
- $$\sigma_d^2 = \frac{N_0}{2} \cdot \int_{-\infty}^{+\infty}|H_{\rm E}(f)|^2 \,{\rm d} f\hspace{0.3cm}\Rightarrow \hspace{0.3cm}{\rm Minimum,} \hspace{0.5cm}{\rm where}\hspace{0.5cm} H_{\rm E}(f) =\frac {H_{\rm CRO}(f)}{{\rm si}(\pi f T)}\hspace{0.05cm}.$$
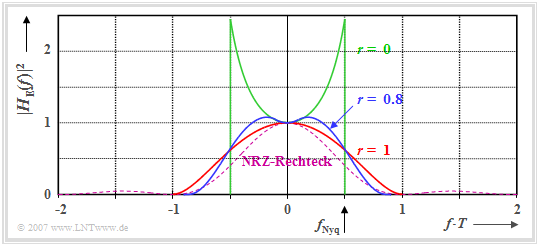
The diagram shows the power transmission function $|H_{\rm E}(f)|^2$ for three different rolloff factors. The areas under each of these curves are a measure of the noise power $\sigma_d^2$ before the decision. One can see from this plot:
- The rolloff factor $r = 0$ (square–wave frequency response) leads only to efficiency $\eta_{\rm A} \approx 0.65$, despite the very narrowband receiver filter, since $H_{\rm E}(f)$ increases with increasing $f$ because of the $\rm si$ function in the denominator.
- Although $r = 1$ causes a spectrum twice as wide, it does not lead to any increase. Since the area under the red curve is smaller than that under the green curve, the result is a better value: $\eta_{\rm A} \approx 0.88$.
- The highest system efficiency results for $r \approx 0.8$ (flat maximum) with $\eta_{\rm A} \approx 0.89$. For this one achieves the best possible compromise between bandwidth and boost.
- By comparison with the optimal frequency response $H_{\rm E}(f) = {\rm si}(\pi f T)$ with peak limitation, which leads to the result $\sigma_d^2 = N_0/(2T)$ ⇒ $\eta_{\rm A}= 1$, we obtain for the system efficiency:
- $$\eta_{\rm A} = \left [T \cdot \int_{-\infty}^{+\infty}\hspace{-0.15cm} |H_{\rm E}(f)|^2 \,{\rm d} f \right ]^{-1} \hspace{0.05cm}.$$
$\text{Conclusion:}$
- The absolute optimum at peak limitation ⇒ $\eta_{\rm A}= 1$ results only with a rectangular basic transmission pulse $g_s(t)$ and a likewise rectangular receiver filter pulse response $h_{\rm E}(t)$ of the same width $T$.
- The best cosine rolloff Nyquist spectrum with $r = 0.8$ (blue curve) is about $0.5 \ \rm dB$ worse compared to the matched filter (violet-dashed curve), because the area under the blue curve is about $12\%$ larger than the area under the violet curve.
- The so-called root–root configuration ⇒ $H_{\rm S}(f) \cdot H_{\rm E}(f) =\sqrt{H_{\rm CRO}(f)}$ thus only makes sense if one assumes power limitation.
Exercises for the chapter
Exercise 1.6: Root Nyquist System
Exercise 1.6Z: Two Optimal Systems
Exercise 1.7: System Efficiencies
References
- ↑ Bronstein, I.N.; Semendjajew, K.A.: Taschenbuch der Mathematik. 5. Auflage. Frankfurt: Harry Deutsch, 2001.


