Exercise 4.4Z: Signal-to-Noise Ratio with PCM
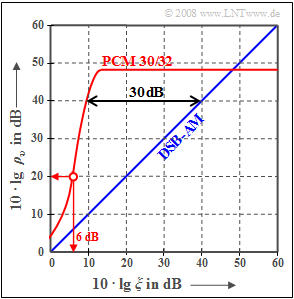
The graph shows the signal-to-noise ratio $10 ⋅ \lg \ ρ_v$ for pulse code modulation $\rm (PCM)$ compared to analog double-sideband amplitude modulation, abbreviated as "$\rm DSB-AM$".
For the latter, $ρ_v = ξ$, where the persormanc parameter
- $$\xi = \frac{\alpha^2 \cdot P_{\rm S}}{N_0 \cdot f_{\rm N}} $$
summarizes the following system parameters:
- the frequency-independent attenuation factor $α$ of the transmission channel,
- the power $P_{\rm S}$ of the transmit signal $s(t)$, , also called "transmit power" for short,
- the message frequency $f_{\rm N}$ (bandwidth) of the cosine source signal $q(t)$,
- the noise power density $N_0$ of the AWGN noise.
For the PCM system, the following approximation for the sink SNR was given on the page "Estimation of SNR degradation due to bit errors", which also takes into account transmission errors due to AWGN noise:
- $$ \rho_{\upsilon}= \frac{1}{ 2^{-2N } + 4 \cdot p_{\rm B}} \hspace{0.05cm}.$$
- Here $N$ denotes the number of bits per sample and $p_{\rm B}$ the bit error probability.
- Since $ξ$ can in digital modulation also be interpreted as the "signal energy per bit" related to the "noise power density" $(E_{\rm B}/N_0)$, with the complementary Gaussian error signal ${\rm Q}(x)$ approximately:
- $$ p_{\rm B}= {\rm Q} \left ( \sqrt{2 \xi }\right ) \hspace{0.05cm}.$$
Hints:
- The exercise belongs to the chapter "Pulse Code Modulation".
- Reference is made in particular to the pages "Influence of transmission errors" and "Estimation of SNR degradation due to transmission errors".
- The PCM considered here is the PCM 30/32, whose system parameters are given, e.g. in Exercise 4.1 .
Questions
Solution
- Here, with the quantization step number $M = 2^N$:
- $$ \rho_{v} (\xi \rightarrow \infty) = \rho_{\rm Q} = M^2 = 2^{2N} \hspace{0.3cm}\rightarrow \hspace{0.3cm} 10 \cdot {\rm lg}\hspace{0.1cm}\rho_{v} \approx 6\,{\rm dB} \cdot N\hspace{0.05cm}.$$
- From the readable signal-to-noise ratio $10 ⋅ \lg \ ρ_v ≈ 48 \ \rm dB$ it follows $N_1\hspace{0.15cm}\underline { = 8}$ bits per sample and for the quantization level number $M = 256$.
(2) From the above approximation, we obtain for $N_2\hspace{0.15cm}\underline { = 11}$ bits per sample ⇒ $M = 2048$ the signal-to-noise ratio $66 \rm dB$.
- With $N = 10$ ⇒ $M = 1024$ one reaches only approx. $60 \ \rm dB$.
- For the compact disc (CD), the PCM parameters $N = 16$ ⇒ $M = 65536$ ⇒ $10 ⋅ \lg \ ρ_v > 96 \ \rm dB$ are used.
(3) For double sideband amplitude modulation, this would require $10 ⋅ \lg \ ξ = 40\ \rm dB$ .
- As can be seen from the graph on the data page, this abscissa value for the given PCM is lower by $30 \ \rm dB$ ⇒ $10 ⋅ \lg \ ξ_{40\ \rm dB}\hspace{0.15cm}\underline { = 10 \ \rm dB}$.
(4) The logarithmic value $30 \ \rm dB$ corresponds to a power reduced by a factor $10^3\hspace{0.15cm}\underline { = 1000}$ .
(5) From the graph on the information page, it can be seen that the abscissa value $10 ⋅ \lg \ ξ= 6 \ \rm dB$ results in the signal-to-noise ratio $20 \ \rm dB$ .
- From $10 ⋅ \lg \ ρ_v = 20 \ \rm dB$ follows $ρ_v = 100$ and thus further $($with $N = N_1 = 8)$:
- $$\rho_{\upsilon}= \frac{1}{ 2^{-2N } + 4 \cdot p_{\rm B}} \approx \frac{1}{ 1.5 \cdot 10^{-5} + 4 \cdot p_{\rm B}} = 100 \hspace{0.3cm} \Rightarrow \hspace{0.3cm} p_{\rm B} = \frac{0.01 - 1.5 \cdot 10^{-5}}{ 4} \hspace{0.15cm}\underline {\approx 2.5\%} \hspace{0.05cm}.$$
(6) With the same $ξ$ the bit error probability is still $p_{\rm B} = 0.025$. Thus, with $N = 3$ (bits per sample):
- $$\rho_{\upsilon}= \frac{1}{ 2^{-6 } + 4 \cdot p_{\rm B}} = \frac{1}{ 0.015625 + 0.01} \approx 39 \hspace{0.3cm} \Rightarrow \hspace{0.3cm}10 \cdot {\rm lg} \hspace{0.15cm}\rho_{\upsilon}\hspace{0.15cm}\underline {\approx 15.9\,{\rm dB}} \hspace{0.05cm}.$$
Further, it should be noted:
- With only three bits per sample, the quantization noise power $(P_{\rm Q} = 0.015625)$ is already larger than the error noise power $(P_{\rm F} = 0.01)$.
- By increasing the transmit power, the signal-to-noise ratio could be maximum $10 ⋅ \lg \ ρ_v =18 \ \rm dB$ because of quantization, if no bit errors occur $(P_{\rm F} = 0)$.
