Contents
Rayleigh and Rice Distribution
The estimation of the phase angle from the incoming signal, which is required for coherent demodulation, is not possible or only possible to a limited extent in many applications. For example, the movement of a mobile subscriber at high speed leads to very rapid temporal changes in the phase angle $\phi$, which makes its sufficiently accurate determination difficult or even impossible.
This fact leads to the non-coherent demodulation processes with the advantage of reduced complexity, but with increased probability of falsification. In the derivation of the equations one encounters two probability density functions, which are given here in advance:
- The Rayleigh distribution is obtained for the PDF of the random variable $y$ with realization $\eta$, which is obtained from the two Gaussian distributed and statistically independent components $u$ and $v$ (both with the same standard deviation $\sigma_n)$ as follows:
- \[y = \sqrt{u^2 + v^2} \hspace{0.3cm} \Rightarrow \hspace{0.3cm} p_y (\eta) ={\eta}/{\sigma_n^2} \cdot {\rm exp } \left [ - {\eta^2}/{ (2\sigma_n^2)}\right ] \hspace{0.05cm}.\]
- The Rice distribution is obtained under the same boundary conditions for the case where a constant $C$ is added to one of the components $($either $u$ or $v)$:
- \[y = \sqrt{(u+C)^2 + v^2} \hspace{0.3cm} \Rightarrow \hspace{0.3cm} p_y (\eta) = {\eta}/{\sigma_n^2} \cdot {\rm exp } \left [ - ({\eta^2 + C^2})/(2 \sigma_n^2) \right ] \cdot {\rm I }_0 \left [{\eta \cdot C}/{ \sigma_n^2}\right ] \hspace{0.05cm}.\]
- The Rice distribution uses the modified zero-order Bessel function, whose definition and series expansion are as follows:
- \[{\rm I }_0 (x) = \frac{1}{ 2\pi} \cdot \int_{0}^{2\pi} {\rm e }^{-x \hspace{0.03cm}\cdot \hspace{0.03cm}\cos(\alpha)} \,{\rm d} \alpha \hspace{0.2cm} \approx \hspace{0.2cm} \sum_{k = 0}^{\infty} \frac{(x/2)^{2k}}{k! \cdot \Gamma (k+1)} \hspace{0.05cm}.\]
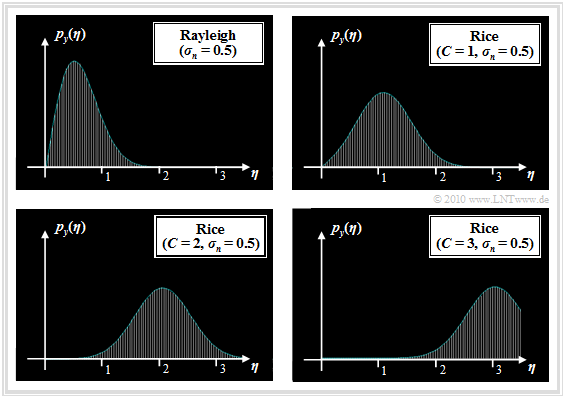
The graph shows the probability density functions of Rayleigh and Rice distributions.
To this representation it is to be noted:
- The Rice distribution is determined by the two parameters $C$ and $\sigma_n$. With $C = 0$, the Rice PDF is identical to the Rayleigh PDF.
- The Rayleigh PDF with larger $\sigma_n$ is of the same shape as shown for $\sigma_n = 0.5$, but wider and lower in the ratio of standard deviation.
- $\sigma_n$ indicates the standard deviation of the two Gaussian distributed random variables $u$ and $v$ and not the standard deviation of the Rayleigh distributed random variable $y$. Rather, the following applies to the latter:
- \[\sigma_y = \sigma_n \cdot \sqrt{2 - {\pi}/{2 }} \hspace{0.2cm} \approx \hspace{0.2cm} 0.655 \cdot \sigma_n \hspace{0.05cm}.\]
- The Rayleigh distribution is extremely asymmetric, recognizable by the (relatively) large value for the "third order central moment" ⇒ Charlier's skewness:
- $$\mu_3/\sigma_y \approx 0.27.$$
- The Rice distribution is more symmetric the larger the ratio $C/\sigma_n$ is. For $C/\sigma_n \ge 4$, $\mu_3 \approx 0$. The larger $C/\sigma_n$ is, the more the Rice distribution $($with $C$, $\sigma_n)$ approaches a "Gaussian distribution" with mean $C$ and standard deviation $\sigma_n$:
- \[p_y (\eta) \approx \frac{1}{\sqrt{2\pi} \cdot \sigma_n} \cdot {\rm exp } \left [ - \frac{(\eta - C)^2}{2 \sigma_n^2}\right ] \hspace{0.3cm} \Rightarrow \hspace{0.3cm} m_y = C\hspace{0.05cm},\hspace{0.2cm}\sigma_y = \sigma_n \hspace{0.05cm}.\]
Non-coherent demodulation of on–off keying
We consider "on–off keying" (or 2–ASK) in the equivalent low-pass range.
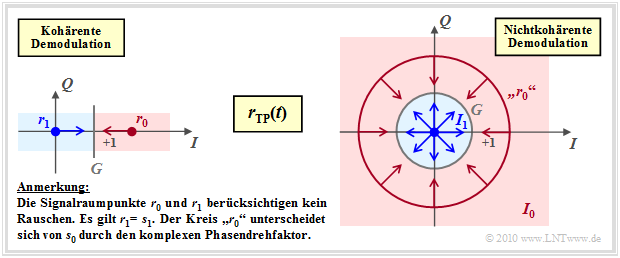
- In the case of coherent demodulation (left graph), the signal space constellation of the received signal is the same as that of the transmitted signal and consists of two points.
- The decision boundary $G$ lies in the middle between these points $\boldsymbol{r}_0$ and $\boldsymbol{r}_1$.
- The arrows mark the rough direction of noise vectors that may cause transmission errors.
On the other hand, for non-coherent demodulation (right graph):
- The point $\boldsymbol{r}_1 = \boldsymbol{s}_1 = 0$ is still preserved. On the other hand, $\boldsymbol{r}_0 = \boldsymbol{s}_0 \cdot {\rm e}^{\hspace{0.02cm}{\rm j}\hspace{0.03cm}\phi}$ can lie on any point of the circle around $\boldsymbol{s}_0$, since $\phi$ is unknown.
- The decision process taking into account the AWGN noise can now be interpreted in two dimensions, as indicated by the arrows in the right graph.
- The decision area $I_1$ is a circle whose radius $G$ is an optimizable parameter. The decision area $I_0$ lies outside the circle.
Thus, the structure of the optimal OOK receiver (in the equivalent low–pass range) is fixed. According to this second graph:
- The input signal $\boldsymbol{r}(t) = \boldsymbol{s}(t) \cdot {\rm e}^{\hspace{0.02cm}{\rm j}\hspace{0.03cm}\phi} + \boldsymbol{n}(t)$ is generally complex because of the phase angle $\phi$ and because of the complex noise term $\boldsymbol{n}(t)$. Consequently, what is required now is the correlation between the complex received signal $\boldsymbol{r}(t)$ and a complex basis function $\boldsymbol{\xi}_1(t)$.
- The result is the (complex) detector value $\boldsymbol{r}$, from which the amount $y = |\boldsymbol{r}(t)|$ is formed as a real decision input variable.
- If the decision value $y \gt G$, then $m_0$ is output as the estimated value, otherwise $m_1$. Thus, the error probability for equally probable symbols is:
- \[p_{\rm S} = {\rm Pr}({\cal{E}}) = {1}/{ 2} \cdot \int_{0}^{G} p_{y\hspace{0.05cm}\vert \hspace{0.05cm}m} (\eta \hspace{0.05cm}|\hspace{0.05cm} m_0) \,{\rm d} \eta + {1}/{ 2} \cdot \int_{G}^{\infty} p_{y\hspace{0.05cm}\vert \hspace{0.05cm}m} (\eta \hspace{0.05cm}\vert \hspace{0.05cm} m_1) \,{\rm d} \eta \hspace{0.05cm}.\]
- However, due to the Rice PDF $p_{y\hspace{0.05cm}|\hspace{0.05cm}m} (\eta\hspace{0.05cm}|\hspace{0.05cm}m_0)$ and the Rayleigh PDF $p_{y\hspace{0.05cm}|\hspace{0.05cm}m} (\eta\hspace{0.05cm}|\hspace{0.05cm}m_1)$, this probability can only be determined numerically. The optimal decision boundary $G$ has to be determined beforehand as the solution of the following equation:
- \[p_{y\hspace{0.05cm}\vert \hspace{0.05cm}m} (G \hspace{0.05cm}|\hspace{0.05cm}m_0) = p_{y\hspace{0.05cm}|\hspace{0.05cm}m} (G \hspace{0.05cm}|\hspace{0.05cm}m_1) \hspace{0.05cm}.\]
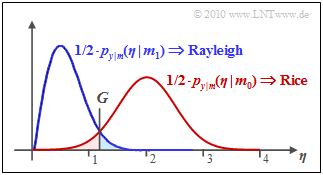
$\text{Example 1:}$ The graph shows the result of this equation for $\sigma_n = 0.5$ and $C = 2$, where the (red) Rice PDF is approximated by a Gaussian PDF with mean $C$ and standard deviation $\sigma_n$. One can see from this:
- The optimal decision boundary $($here: $G \approx 1.25)$ results from the intersection of the two curves.
- The symbol error probability $p_{\rm S}$ is the sum of the two colored areas. In the example, $p_{\rm S} \approx 5\%$ results.
You can determine the error probability for other values of $C$ and $\sigma_n$ as well as the optimal decision boundary $G$ using the calculation tool "Non-coherent On-Off Keying".
Non-coherent demodulation of binary FSK (2–FSK)
As already shown in the "last chapter", Binary Frequency Shift Keying (2–FSK) in the equivalent low-pass range can be described by the basis functions
- \[\xi_1(t) = \sqrt{1/T} \cdot {\rm e}^{\hspace{0.05cm}+{\rm j} \hspace{0.03cm}\cdot \hspace{0.03cm} \pi \hspace{0.03cm}\cdot \hspace{0.03cm} h \hspace{0.03cm}\cdot \hspace{0.03cm}t/T}\hspace{0.05cm},\hspace{0.2cm} 0 \le t \le T\hspace{0.05cm},\]
- \[ \xi_2(t) = \sqrt{1/T} \cdot {\rm e}^{\hspace{0.05cm}-{\rm j} \hspace{0.03cm}\cdot \hspace{0.03cm} \pi \hspace{0.03cm}\cdot \hspace{0.03cm} h \hspace{0.03cm}\cdot \hspace{0.03cm}t/T}\hspace{0.05cm},\hspace{0.2cm} 0 \le t \le T \hspace{0.05cm}\]
To achieve orthogonality between these two complex basis functions, the "modulation index" $h$ must be chosen to be integer:
- \[< \hspace{-0.05cm}\xi_1(t) \hspace{0.1cm} \cdot \hspace{0.1cm} \xi_2(t) \hspace{-0.05cm}> \hspace{0.2cm}= 0 \hspace{0.3cm} \Rightarrow \hspace{0.3cm} h = 2 \cdot \Delta f_{\rm A} \cdot T\hspace{0.05cm}= 1, 2, 3, \text{...}\]
The diagram shows the structure for non-coherent orthogonal demodulation of binary FSK.
In the noise-free case ⇒ $n(t) \equiv 0$ applies to the outputs of the two correlators:
- \[r_1 = \hspace{0.2cm} < \hspace{-0.05cm}r(t) \hspace{0.1cm} \cdot \hspace{0.1cm} \xi_1(t) \hspace{-0.05cm}> \hspace{0.2cm}= 0\hspace{0.05cm}, \hspace{0.2cm} {\rm falls}\hspace{0.15cm} m = m_1\hspace{0.05cm},\]
- \[ r_2 = \hspace{0.2cm} < \hspace{-0.05cm}r(t) \hspace{0.1cm} \cdot \hspace{0.1cm} \xi_2(t) \hspace{-0.05cm}> \hspace{0.2cm}= 0\hspace{0.05cm}, \hspace{0.2cm} {\rm falls}\hspace{0.15cm} m = m_0\hspace{0.05cm}.\]
After respective amount formation ⇒ $y_1 = |r_1|, \ \ y_2 = |r_2|$ the following decision rule is then applicable:
- \[\hat{m} = \left\{ \begin{array}{c} m_0 \\ m_1 \end{array} \right.\quad \begin{array}{*{1}c} {\rm if}\hspace{0.15cm} y_1 > y_2 \hspace{0.05cm}, \\ {\rm if}\hspace{0.15cm} y_1 < y_2 \hspace{0.05cm}.\\ \end{array}\]
For a simpler realization of the decision, the difference $y_1 - y_2$ can also be evaluated with the decision boundary $G = 0$.
Error probability with non-coherent 2–FSK demodulation
In the following, the error probability is calculated under the assumption that $m = m_0$ was sent. Under the further assumption of equally probable binary messages $m_0$ and $m_1$, the absolute error probability is exactly the same:
- $${\rm Pr}({\cal{E}}) = {\rm Pr}({\cal{E}}\hspace{0.05cm} | \hspace{0.05cm}m_0) \hspace{0.05cm}.$$
With $m = m_0$ we get for the complex correlation output values $r_i$ and their amounts $y_i$:
- \[r_1 = \sqrt{E} \cdot {\rm e}^{{\rm j}\phi} + n_1\hspace{0.3cm} \Rightarrow \hspace{0.3cm}y_1 = |r_1|\hspace{0.15cm}{\rm is}\hspace{0.15cm}{\rm Rice}\hspace{0.15cm}{\rm distributed} \hspace{0.05cm},\]
- \[ r_2 = n_2\hspace{0.3cm} \Rightarrow \hspace{0.3cm}y_2 = |r_2|\hspace{0.15cm}{\rm ist}\hspace{0.15cm}{\rm rayleighverteilt} \hspace{0.05cm}.\]
Hierbei steht $E$ wegen $M = 2$ für die Symbolenergie $(E_{\rm S})$ und die Bitenergie $(E_{\rm B})$ gleichermaßen, und $n_1$ und $n_2$ sind unkorrelierte komplexe Rauschgrößen mit Mittelwert Null und Varianz $2 \cdot \sigma_n^2$. Somit lautet die Verbundwahrscheinlichkeitsdichtefunktion:
- \[p_{y_1,\hspace{0.03cm} y_2 \hspace{0.03cm}| \hspace{0.03cm}m} ( \eta_1, \eta_2 \hspace{0.05cm}| \hspace{0.05cm}m_0) = p_{y_1 \hspace{0.01cm}| \hspace{0.03cm}m} ( \eta_1 \hspace{0.05cm}| \hspace{0.05cm}m_0) \cdot p_{y_2 \hspace{0.03cm}| \hspace{0.03cm}m} ( \eta_2 \hspace{0.05cm}| \hspace{0.05cm}m_0) \hspace{0.05cm},\]
- \[\Rightarrow \hspace{0.5cm} p_{y_1 \hspace{0.01cm}| \hspace{0.03cm}m} ( \eta_1 \hspace{0.05cm}| \hspace{0.05cm}m_0) = {\eta_1}/{\sigma_n^2} \cdot {\rm e }^{ - ({\eta_1^2 + E})/({2 \sigma_n^2}) }\cdot {\rm I }_0 \left [{\eta_1 \cdot \sqrt{E}}/{ \sigma_n^2}\right ] \hspace{0.05cm}, \hspace{0.5cm} p_{y_2 \hspace{0.01cm}| \hspace{0.03cm}m} ( \eta_2 \hspace{0.05cm}| \hspace{0.05cm}m_0) = {\eta_2}/{\sigma_n^2} \cdot {\rm e }^{ - \eta_2^2 /({2 \sigma_n^2}) } \hspace{0.05cm}.\]
Die Fehlerwahrscheinlichkeit ergibt sich allgemein wie folgt:
- \[{\rm Pr}({\cal{E}}) = \int_{0}^{\infty} \int_{\eta_1}^{\infty} p_{y_1,\hspace{0.03cm} y_2 \hspace{0.03cm}| \hspace{0.03cm}m} ( \eta_1, \eta_2 \hspace{0.05cm}| \hspace{0.05cm}m_0) \,\,{\rm d} \eta_2\,\,{\rm d} \eta_1 = \int_{0}^{\infty} p_{y_1 \hspace{0.01cm}| \hspace{0.03cm}m} ( \eta_1 \hspace{0.05cm}| \hspace{0.05cm}m_0) \cdot \int_{\eta_1}^{\infty} p_{y_2 \hspace{0.03cm}| \hspace{0.03cm}m} ( \eta_2 \hspace{0.05cm}| \hspace{0.05cm}m_0)\,\,{\rm d} \eta_2\,\,{\rm d} \eta_1 \hspace{0.05cm}.\]
$\text{Fazit:}$ Für die Fehlerwahrscheinlichkeit bei nichtkohärenter Demodulation der binären FSK erhält man nach einigen mathematischen Umformungen das überraschend einfache Ergebnis
- \[p_{\rm S} = {\rm Pr}({\cal{E} }) = {1}/{2} \cdot {\rm e}^{-E_{\rm S}/(2 N_0)} \hspace{0.05cm}.\]
Zum Vergleich sei nochmals das Ergebnis für die kohärente Demodulation angegeben:
- \[p_{\rm S} = {\rm Pr}({\cal{E} }) = {\rm Q}(\sqrt{ E_{\rm S}/N_0}) \hspace{0.05cm}.\]
$\text{Herleitung:}$ Das vorweg genommene Ergebnis soll nun in einigen Rechenschritten hergeleitet werden. Wir gehen dabei von den folgenden Gleichungen aus:
- $${\rm Pr}({\cal{E} }) = \int_{0}^{\infty} p_{y_1 \hspace{0.01cm} \vert\hspace{0.03cm}m} ( \eta_1 \hspace{0.05cm} \vert \hspace{0.05cm}m_0) \cdot \int_{\eta_1}^{\infty} p_{y_2 \hspace{0.03cm}\vert \hspace{0.03cm}m} ( \eta_2 \hspace{0.05cm}\vert \hspace{0.05cm}m_0)\,\,{\rm d} \eta_2\,\,{\rm d} \eta_1 \hspace{0.05cm},\hspace{0.5cm}\text{mit}$$
- $$p_{y_1 \hspace{0.01cm}\vert \hspace{0.03cm}m} ( \eta_1 \hspace{0.05cm}\vert \hspace{0.05cm}m_0) = {\eta_1}/{\sigma_n^2} \cdot {\rm e }^{ - ({\eta_1^2 + E})/({2 \sigma_n^2}) }\cdot {\rm I }_0 \left [{\eta_1 \cdot \sqrt{E} }/{ \sigma_n^2}\right ] \hspace{0.05cm},\hspace{0.5cm}p_{y_\hspace{0.01cm}\vert \hspace{0.03cm}m} ( \eta_2 \hspace{0.05cm}\vert \hspace{0.05cm}m_0) = {\eta_2}/{\sigma_n^2} \cdot {\rm e }^{ - \eta_2^2 /({2 \sigma_n^2}) } \hspace{0.05cm}.$$
(1) Das innere Integral gibt die Wahrscheinlichkeit an, dass die rayleighverteilte Zufallsgröße $\eta_2$ größer ist als $\eta_1$ – siehe Musterlösung zur Aufgabe 4.17Z:
- $$\int_{\eta_1}^{\infty} p_{y_2 \hspace{0.03cm}\vert\hspace{0.03cm}m} ( \eta_2 \hspace{0.05cm}\vert \hspace{0.05cm}m_0)\,\,{\rm d} \eta_2 = {\rm e }^{ - \eta_1^2 /({2 \sigma_n^2}) } \hspace{0.3cm} \Rightarrow \hspace{0.3cm} {\rm Pr}({\cal{E} }) = \int_{0}^{\infty}{\eta_1}/{\sigma_n^2} \cdot {\rm e }^{ - ({2\eta_1^2 + E})/({2 \sigma_n^2}) }\cdot {\rm I }_0 \left [ {\eta_1 \cdot \sqrt{E} }/{ \sigma_n^2}\right ]\,\,{\rm d} \eta_1 \hspace{0.05cm}.$$
(2) Mit den (willkürlichen) Substitutionen $C_0^2 = E/4$ und $\sigma_0^2 = \sigma_n^2/2$ erhält man daraus:
- $${\rm Pr}({\cal{E} }) = \int_{0}^{\infty} \frac{\eta_1}{2 \cdot \sigma_0^2} \cdot {\rm exp } \left [ - \frac{2 \eta_1^2 + 4 C_0^2}{4 \sigma_0^2}\right ] \cdot {\rm I }_0 \left [ \frac{\eta_1 \cdot 2C_0}{ 2 \sigma_0^2}\right ]\,\,{\rm d} \eta_1 = \int_{0}^{\infty} \frac{\eta_1}{2 \cdot \sigma_0^2} \cdot {\rm exp } \left [ - \frac{\eta_1^2 + 2 C_0^2}{2 \sigma_0^2}\right ] \cdot {\rm I }_0 \left [ \frac{\eta_1 \cdot C_0}{ \sigma_0^2}\right ]\,\,{\rm d} \eta_1 \hspace{0.05cm}.$$
(3) Durch Verschieben von Anteilen vor das Integral gelingt es, dass der Integrand wieder eine Riceverteilung beschreibt:
- \[{\rm Pr}({\cal{E} }) = {1}/{2} \cdot {\rm exp } \left [ - \frac{ C_0^2}{2 \sigma_0^2}\right ] \cdot \int\limits_{0}^{\infty} \frac{\eta_1}{ \sigma_0^2} \cdot {\rm exp } \left [ - \frac{\eta_1^2 + C_0^2}{2 \sigma_0^2}\right ] \cdot {\rm I }_0 \left [ \frac{\eta_1 \cdot C_0}{ \sigma_0^2}\right ]\,\,{\rm d} \eta_1 \hspace{0.05cm}.\]
(4) Der Integrand beschreibt nun die Rice–WDF. Das Integral über das gesamte Definitionsgebiet von $0$ bis $+\infty$ ergibt wie bei jeder WDF den Wert Eins, so dass gilt:
- \[{\rm Pr}({\cal{E} }) = {1}/{2} \cdot {\rm exp } \left [ - \frac{ C_0^2}{2 \sigma_0^2}\right ]\hspace{0.05cm}.\]
(5) Mit $C_0^2 = E/4$ und $\sigma_0^2 = \sigma_n^2/2$ sowie der allgemein gültigen Beziehung $\sigma_n^2 = N_0$ erhält man schließlich:
- $${\rm Pr}({\cal{E} }) = {1}/{2} \cdot {\rm exp } \left [ - \frac{ C_0^2}{2 \sigma_0^2}\right ] = {1}/{2} \cdot {\rm exp } \left [ - \frac{ E_{\rm S}/4}{N_{\rm 0}/2}\right ] \hspace{0.3cm}\Rightarrow \hspace{0.3cm} p_{\rm S} = {\rm Pr}({\cal{E} }) = {1}/{2} \cdot {\rm e}^{-E_{\rm S}/(2 N_0)}\hspace{0.05cm}.$$
q.e.d. $E_{\rm S}$ gibt hierbei die mittlere Signalenergie pro Symbol an, die bei FSK gleich der Normierungsenergie $E$ ist.
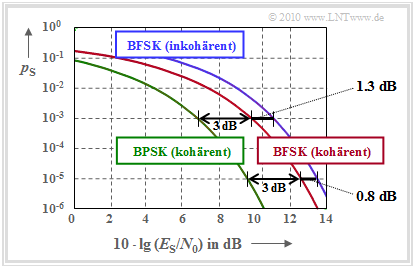
$\text{Beispiel 2:}$ Die Grafik stellt die Fehlerwahrscheinlichkeitskurven beider Demodulationsverfahren in Abhängigkeit des AWGN–Qotienten $E_{\rm S}/N_0$ vergleichend gegenüber.
Man erkennt:
- Die nichtkohärente FSK (rote Kurve) benötigt gegenüber der kohärenten FSK (blaue Kurve) bei $p_{\rm S}= 10^{-5}$ ein um $0.8 \ \rm dB$ größeres $E_{\rm S}/N_0$.
- Bei $p_{\rm S}= 10^{-3}$ beträgt der Abstand sogar $1.3 \ \rm dB$.
- Dagegen beträgt der Abstand zwischen der kohärenten binären FSK von der kohärenten BPSK unabhängig von der Fehlerwahrscheinlichkeit stets $1.3 \ \rm dB$.
Nichtkohärente Demodulation von mehrstufiger FSK
Wir betrachten nun die Nachrichtenmenge $\{m_1, m_2,\hspace{0.05cm}\text{ ...} \hspace{0.05cm}, m_{M}\}$ und bezeichnen $M$ als Stufenzahl.
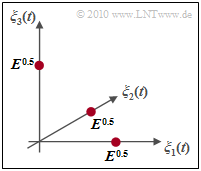
- Voraussetzung für die Anwendung des Modulationsverfahrens "Frequency Shift Keying" und zugleich eines nichtkohärenten Demodulators ist wie bei der binären FSK ein ganzzahliger Modulationsindex $h$.
- In diesem Fall ist die $M$–stufige FSK orthogonal und es ergibt sich eine Signalraumkonstellation, wie in der nebenstehenden Grafik für den Sonderfall $M = 3$ dargestellt.
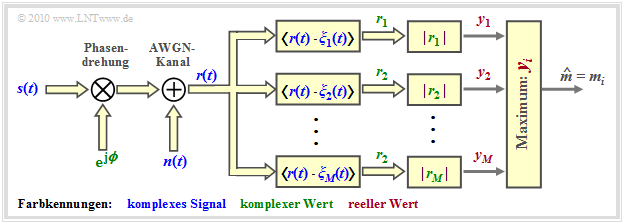
Der nichtkohärente Demodulator ist nachfolgend skizziert. Gegenüber der Empfängerstruktur für binäre FSK unterscheidet sich dieser Empfänger lediglich durch $M$ Zweige anstelle von nur zweien, welche die Vergleichswerte $y_1$, $y_2$, ... , $y_M$ liefern.
Zur Berechnung der Fehlerwahrscheinlichkeit gehen wir von der Annahme aus, dass $m_1$ gesendet wurde. Das bedeutet, dass die Entscheidung richtig ist, wenn der größte Detektionsausgangswert $y_1$ ist:
- \[{\rm Pr}({\cal{C}}) \hspace{-0.1cm} = \hspace{-0.1cm} {\rm Pr} \big [ (y_2 < y_1) \cap (y_3 < y_1) \cap ... \cap (y_{M} < y_1) \hspace{0.05cm}| \hspace{0.05cm} m = m_1\big ] = {\rm Pr} \left [ \hspace{0.1cm} \bigcap\limits_{k = 2}^M (y_k < y_1) \hspace{0.05cm}| \hspace{0.05cm}m = m_1\right ] \hspace{0.01cm}.\]
$\text{Fazit:}$
- Die Fehlerwahrscheinlichkeit der M–stufigen FSK bei nichtkohärenter Demodulation ist gleich ${\rm Pr}({\cal{E} }) = 1 - {\rm Pr}({\cal{C} })$.
- Nachfolgend wird gezeigt, dass ${\rm Pr}({\cal{C} })$ wie folgt dargestellt werden kann:
- \[{\rm Pr}({\cal{C} }) = \sum_{i = 0}^{M-1} (-1)^i \cdot {M-1 \choose i } \cdot \frac{1}{i+1} \cdot {\rm exp } \left [ - \frac{i \cdot E_{\rm S} } {(i+1) \cdot N_0}\right ] \hspace{0.05cm}\hspace{0.5cm} \text{mit}\hspace{0.5cm} E_{\rm S} = E_{\rm B} \cdot {\rm log_2}(M)\hspace{0.05cm}.\]
- Im Sonderfall $M = 2$ ergibt sich natürlich wieder das im letzten Abschnitt erhaltene Ergebnis:
- \[p_{\rm S} = {\rm Pr}({\cal{E} }) = {1}/{2} \cdot {\rm e}^{-E_{\rm S}/(2 N_0)} \hspace{0.05cm}.\]
$\text{Herleitung:}$ Das vorweg genommene Ergebnis soll nun in einigen Rechenschritten hergeleitet werden. Wir gehen von der Annahme aus, dass $m_1$ gesendet wurde. Das bedeutet, dass die Entscheidung richtig ist, wenn der größte Detektionsausgangswert $y_1$ ist. Ansonsten gibt es gewisse Analogien zur Herleitung der BFSK–Fehlerwahrscheinlichkeit.
(1) Mit der bedingten Wahrscheinlichkeitsdichte $p_{y_1 \hspace{0.01cm} \vert\hspace{0.03cm}m} ( \eta_1 \hspace{0.05cm} \vert \hspace{0.05cm}m_1)$ erhält man:
- \[{\rm Pr}({\cal{C} }) = \int_{0}^{\infty} {\rm Pr} \left [ \hspace{0.1cm} \bigcap\limits_{k = 2}^M (y_k < y_1) \hspace{0.05cm}\vert\hspace{0.05cm}y_1 = \eta_1, m = m_1\right ] \cdot p_{y_1 \hspace{0.01cm} \vert\hspace{0.03cm}m} ( \eta_1 \hspace{0.05cm} \vert \hspace{0.05cm}m_1) \,\,{\rm d} \eta_1 \hspace{0.05cm}.\]
(2) Die Entscheidungswerte $y_2$, $y_3$, ... , $y_M$ sind bei gegebenem $y_1$ statistisch unabhängig. Deshalb gilt:
- \[{\rm Pr}({\cal{C} }) = \int_{0}^{\infty} \left \{ {\rm Pr} \big [ (y_2 < y_1) \hspace{0.05cm}\vert \hspace{0.05cm}y_1 = \eta_1, m = m_1\big ] \right \}^{M-1} \cdot p_{y_1 \hspace{0.01cm} \vert\hspace{0.03cm}m} ( \eta_1 \hspace{0.05cm} \vert \hspace{0.05cm}m_1) \,\,{\rm d} \eta_1 \hspace{0.05cm}.\]
(3) Der ausgewählte Wert $y_2$ konditioniert auf $m_1$ besitzt eine Rayleighverteilung mit Parameter $\sigma_n^2$:
- \[{\rm Pr} \big [ (y_2 < y_1) \hspace{0.05cm} \vert \hspace{0.05cm}y_1 = \eta_1, m = m_1\big ] \hspace{-0.1cm} = \hspace{-0.1cm} \int_{0}^{\eta_1} p_{y_2 \hspace{0.01cm} \vert\hspace{0.03cm}m} ( \eta_2 \hspace{0.05cm} \vert \hspace{0.05cm}m_1)\,\,{\rm d} \eta_2= 1 - {\rm exp } \big [ - {\eta_1^2 }/({2 \sigma_n^2})\big ] = 1 - a \hspace{0.2cm}{\rm(Abk\ddot{u}rzung)} \hspace{0.05cm}.\]
(4) Gesucht ist nun der Ausdruck $(1 -a)^{M-1}$, für den mit der Abkürzung aus (3) gilt:
- \[ (1-a)^{M-1} \hspace{-0.1cm} = \hspace{-0.1cm} \sum_{i = 0}^{M-1} (-1)^i \cdot {M-1 \choose i } \cdot (-1)^i \cdot a^i = \sum_{i = 0}^{M-1} (-1)^i \cdot {M-1 \choose i } \cdot {\rm exp } \left [ - \frac{i \cdot \eta_1^2 }{2 \sigma_n^2}\right ] \hspace{0.05cm}.\]
(5) $y_1$ besitzt konditioniert auf $m=m_1$ eine Riceverteilung. Die Wahrscheinlichkeit für eine korrekte Entscheidung lässt sich somit in folgende Form bringen:
- \[{\rm Pr}({\cal{C} }) \hspace{-0.1cm} = \hspace{-0.1cm} \sum_{i = 0}^{M-1} (-1)^i \cdot {M-1 \choose i } \cdot \int_{0}^{\infty} {\rm exp } \left [ - \frac{i \cdot \eta_1^2 }{2 \sigma_n^2}\right ] \cdot \frac{\eta_1}{ \sigma_n^2}\cdot {\rm exp } \left [ - \frac{\eta_1^2 + E_{\rm S} }{2 \sigma_n^2}\right ] \cdot {\rm I }_0 \left [ \frac{\eta_1 \cdot \sqrt{E_{\rm S} } }{ \sigma_n^2}\right ] \,\,{\rm d} \eta_1 \hspace{0.05cm}.\]
(6) Durch Substitutionen gelingt es, den Integranden gemäß der Riceverteilung zu gestalten. Da sich jede Wahrscheinlichkeitsdichte zu Eins integriert, erhält man:
- \[{\rm Pr}({\cal{C} }) = \sum_{i = 0}^{M-1} (-1)^i \cdot {M-1 \choose i } \cdot \frac{1}{i+1} \cdot {\rm exp } \left [ - \frac{i \cdot E_{\rm S} } {(i+1) \cdot N_0}\right ] \hspace{0.05cm}\hspace{0.5cm} \text{mit}\hspace{0.5cm} E_{\rm S} = E_{\rm B} \cdot {\rm log_2}(M)\hspace{0.05cm}.\]
(7) Der Sonderfall $M = 2$ führt zum genau gleichen Ergebnis, wie für die binäre FSK berechnet:
- \[{\rm Pr}({\cal{C} }) = (-1)^0 \cdot {2-1 \choose 0 } \cdot \frac{1}{0+1} \cdot {\rm exp } \left [ - \frac{0 \cdot E_{\rm S} } {(i+1) \cdot N_0}\right ] + (-1)^1 \cdot {2-1 \choose 1 } \cdot \frac{1}{1+1} \cdot {\rm exp } \left [ - \frac{1 \cdot E_{\rm S} } {(i+1) \cdot N_0}\right ] \]
- \[ \Rightarrow \hspace{0.5cm} {\rm Pr}({\cal{C} }) = 1 - {1}/{2} \cdot {\rm e }^{-E_{\rm S}/(2N_0)} \hspace{0.5cm} \Rightarrow \hspace{0.5cm} {\rm Pr}({\cal{E} }) = 1 - {\rm Pr}({\cal{C} }) = {1}/{2} \cdot {\rm e }^{-E_{\rm S}/(2N_0)} \hspace{0.05cm}.\]
Aufgaben zum Kapitel
Aufgabe 4.17: Nichtkohärentes On-Off-Keying
Aufgabe 4.17Z: Rayleigh- und Riceverteilung
Aufgabe 4.18: Nichtkohärente_FSK–Demodulation
Aufgabe 4.18Z: BER von kohärenter und nichtkohärenter FSK
Aufgabe 4.19: Orthogonale mehrstufige FSK
