Contents
Prerequisites and optimization criterion
The following block diagram applies to this chapter "Optimization of Baseband Transmission Systems":
Unless explicitly stated otherwise, the following prerequisites are assumed in the following:
- The transmission is binary, bipolar and redundancy-free. The distance between symbols is $T$ and the (equivalent) bit rate $R = 1/T$. Multilevel and/or redundant systems are not discussed until the main chapter 2: Coded and Multilevel Transmission of this book.
- The basic transmission pulse $g_s(t)$ is rectangular and has the amplitude $s_0$ and the pulse duration $T_{\rm S} \le T$. If the transmission pulse duration $T_{\rm S}$ coincides with the symbol duration $T$, we speak of NRZ rectangular pulses. In the case $T_{\rm S} < T$ a RZ format is present.
- The AWGN model with the (one-sided) noise power density $N_0$ is used as the transmission channel, so that $r(t) = s(t) + n(t)$ applies to the received signal. The two-sided noise power density more suitable for system-theoretical investigations is thus $N_0/2$.
- Let the impulse response $h_{\rm E}(t)$ of the receiver filter also be rectangular, but with width $T_{\rm E}$ and height $1/T_{\rm E}$. The equal signal transfer factor is therefore $H_{\rm E}(f = 0) = 1$. Only in the special case $T_{\rm E} = T_{\rm S} $ can $H_{\rm E}(f)$ be called a matched filter.
- In order to exclude intersymbol interfering, the constraint $T_{\rm S} + T_{\rm E} \le 2T$ must always be observed during optimization. Intersymbol interfering will not be considered until the main chapter 3: Intersymbol Interfering and Equalization Methods of this book.
- To obtain the sink symbol sequence, we use a simple threshold decision with optimal decision threshold $E = 0$ and optimal detection times $($under the given conditions at $\nu \cdot T)$.
$\text{Definition:}$ By system optimization we mean here to determine the parameters $T_{\rm S}$ and $T_{\rm E}$ of the basic transmission pulse $g_s(t)$ and the receiver filter impulse response $h_{\rm E}(t)$ in such a way that the bit error probability $p_{\rm B}$ assumes the smallest possible value.
Power and peak limitation
The optimization of the system variables is decisively influenced by whether
power limitation or peak limitation of the transmission signal is required as a constraint of the optimization.
$\text{Definition:}$ Power limitation means that the (average) transmission power $P_{\rm S}$ must not exceed a specified maximum value $P_\text{S, max}$:
- $$P_{\rm S}= {\rm E}[s(t)^2] = \overline{s(t)^2} \le P_{\rm S,\hspace{0.05cm} max}\hspace{0.05cm}.$$
In order to achieve the minimum error probability, one will naturally choose the average transmission power $P_{\rm S}$ as large as possible in the allowed range. Therefore, $P_{\rm S} = P_\text{S, max}$ is always set in the following.
The question of whether power limitation can actually be assumed as a secondary condition of optimization depends on the technical boundary conditions. This assumption is especially justified for radio transmission systems, among other things because the impairment of humans and animals known as "electrosmog" depends to a large extent on the (average) radiated power.
However, the description variables defined here using baseband transmission as an example are modified in the main chapter 4: Generalized Description of Digital Modulation Methods of this book to the effect that they are also applicable to digital carrier frequency systems.
$\text{Definition:}$ Peak value limitation is always referred to when the output range of the transmission device is limited. For bipolar signaling, the corresponding condition is:
- $$\vert s(t) \vert \le s_0\hspace{0.4cm}{\rm{for} }\hspace{0.15cm}{\rm all}\hspace{0.15cm}t.$$
Often, instead of peak limitation, the term amplitude limitation is also used, but this does not quite reflect the facts.
Of course, peak limiting also limits the power, but not the average power, but the peak power.
The secondary condition "peak limitation" is useful and even necessary, for example, if
- the output power range of the transmitter is limited due to nonlinearities of components and power amplifiers, or
- the crosstalk noise must not exceed a limit value at any time. This is especially important when communicating over two-wire lines.
$\text{Example 1:}$ We consider here three different constellations. Let the basic transmission pulse $g_s(t)$ and the receiver filter impulse response $h_{\rm E}(t)$ each be rectangular and the amplitude $g_0$ of the output pulse always coincide with the input pulse amplitude $s_0$.
$\text{System A}$ $(T_{\rm S} = T, \ T_{\rm E} = T)$:
- NRZ basic transmission pulse,
- Matched filter, since $T_{\rm E} = T_{\rm S}$,
- Basic detection pulse: triangle,
- Energy per bit: $E_{\rm B} = s_0^2 \cdot T$,
- Noise power: $\sigma_d^2 = N_0/(2T)$,
- Best possible constellation
- Bit error probability: $p_{\rm B}\hspace{-0.01cm} =\hspace{-0.01cm}{\rm Q} \left( g_0/\sigma_d\right)$
- $$\Rightarrow \hspace{0.3cm}p_{\rm B}= {\rm Q} \left( \sqrt{ {2 \cdot s_0^2 \cdot T}/{N_0} }\right) = {\rm Q} \left( \sqrt{ {2 \cdot E_{\rm B} }/{N_0} }\right)\hspace{0.05cm}.$$
$\text{System B}$ $(T_{\rm S} = T, \ T_{\rm E} = T/2)$:
- NRZ basic transmission pulse,
- No matched filter, since $T_{\rm E} \ne T_{\rm S}$,
- Basic detection pulse: triangle,
- Energy per bit: $E_{\rm B} = s_0^2 \cdot T$,
- Noise power: $\sigma_d^2 = N_0/T$,
- always $\text{3 dB}$ worse than $\text{System A}$
- Bit error probability: $p_{\rm B}\hspace{-0.01cm} =\hspace{-0.01cm}{\rm Q} \left( g_0/\sigma_d\right)$
- $$\Rightarrow \hspace{0.3cm}p_{\rm B}= {\rm Q} \left( \sqrt{ {s_0^2 \cdot T}/{N_0} }\right) = {\rm Q} \left( \sqrt{ E_{\rm B} /{N_0} }\right)\hspace{0.05cm}.$$
$\text{System C}$ $(T_{\rm S} = T/2, \ T_{\rm E} = T/2)$:
- RZ basic transmission pulse,
- Matched filter, since $T_{\rm E} = T_{\rm S}$,
- Basic detection pulse: smaller triangle,
- Energy per bit: $E_{\rm B} = 1/2 \cdot s_0^2 \cdot T$,
- Noise power: $\sigma_d^2 = N_0/T$,
- with power limitation equivalent to $\text{System A}$,
- at peak limitation $\text{3 dB}$ worse than $\text{System A}$,
- Bit error probability: $p_{\rm B}\hspace{-0.01cm} =\hspace{-0.01cm}{\rm Q} \left( g_0/\sigma_d\right)$
- $$\Rightarrow \hspace{0.3cm}p_{\rm B} = {\rm Q} \left( \sqrt{ { s_0^2 \cdot T}/{N_0} }\right)= {\rm Q} \left( \sqrt{2 \cdot {E_{\rm B} }/{N_0} }\right)\hspace{0.05cm}.$$
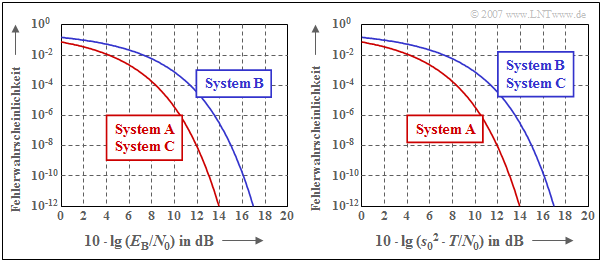
$\text{Example 2:}$ Same conditions as in $\text{Example 1}$ apply.
The diagram shows the bit error probability $p_{\rm B}$
- as a function of the ratio $E_{\rm B}/N_0$ (left diagram) and
- as a function of $s_0^2 \cdot T /N_0$ (right diagram).
Graphically shown are the results derived in $\text{Example 1}$.
These two diagrams in double logarithmic representation are to be interpreted as follows:
- The left diagram compares the systems at the same average power $(P_{\rm S})$ and at constant energy per bit $(E_{\rm B})$, respectively. Since the abscissa value is additionally related to $N_0$, $p_{\rm B}(E_{\rm B}/N_0)$ correctly reflects the situation even for different noise power densities $N_0$.
- When power is limited, configurations $\rm A$ and $\rm C$ are equivalent and represent the optimum in each case. As will be shown on the next pages, an optimal system with power limitation always exists if $g_s(t)$ and $h_{\rm E}(t)$ have the same shape (matched filter). The smaller power of system $\rm C$ is compensated by the abscissa chosen here.
- In contrast, for system $\rm B$ the matched filter condition is not met $(T_{\rm E} \ne T_{\rm S})$ and the error probability curve is now $\text{3 dB}$ to the right of the boundary curve given by systems $\rm A$ and $\rm C$.
- The diagram on the right describes the optimization result with peak limitation, which can be seen from the abscissa labeling. The curve $\rm A$ (NRZ pulse, matched filter) also indicates here the limit curve, which cannot be undershot by any other system.
- Curve $\rm B$ in the diagram on the right has exactly the same shape as in the diagram on the left, since NRZ transmission pulses are again used. The distance of $\text{3 dB}$ from the limit curve is again due to non-compliance with the matched filter condition.
- In contrast to the left diagram, the matched filter system $\rm C$ is now also $\text{3 dB}$ to the right of the optimum. The reason for this degradation is that for the same peak value (same peak power), system $\rm C$ provides only half the average power as system $\rm A$.
System optimization with power limitation
Die Minimierung der Bitfehlerwahrscheinlichkeit $p_{\rm B} = {\rm Q} \left( \sqrt{\rho_d}\right)$ kann aufgrund des monotonen Funktionsverlaufs der komplementären Gaußschen Fehlerfunktion $ {\rm Q}(x)$ auf die Maximierung des Signal–zu–Rausch–Leistungsverhältnisses $\rho_d$ vor dem Schwellenwertentscheider (kurz: Detektions–SNR) zurückgeführt werden:
- $$p_{\rm B} = {\rm Q} \left( \sqrt{\rho_d}\right)\hspace{0.3cm}\Rightarrow \hspace{0.3cm}{\rm Minimum}\hspace{0.8cm}\Rightarrow \hspace{0.8cm}\rho_d ={g_0^2}/{\sigma_d^2}\hspace{0.3cm}\Rightarrow \hspace{0.3cm}{\rm Maximum}\hspace{0.05cm}.$$
Hierbei gibt $g_0 = g_d(t=0)$ die Amplitude des betrachteten Nyquistimpulses an und $\sigma_d^2$ bezeichnet die Detektionsstörleistung für das gegebene Empfangsfilter. Gleichzeitig muss sichergestellt werden, dass
- der Detektionsgrundimpuls $g_d(t) = g_s(t) \star h_{\rm E}(t)$ das erste Nyquistkriterium erfüllt, und
- die Energie des Sendegrundimpulses $g_s(t)$ einen vorgegebenen Wert $E_{\rm B}$ nicht überschreitet.
In den vorangegangenen Abschnitten wurde bereits mehrfach erwähnt, dass beim AWGN–Kanal mit der (einseitigen) Rauschleistungsdichte $N_0$ für das optimale System unter der Nebenbedingung der Leistungsbegrenzung gilt:
- $$p_{\rm B, \hspace{0.08cm}min} = {\rm Q} \left( \sqrt{\rho_{d, \hspace{0.05cm}{\rm max \hspace{0.05cm} | \hspace{0.05cm} L}}}\right)\hspace{0.5cm}{\rm mit}\hspace{0.5cm} \rho_{d, \hspace{0.05cm}{\rm max \hspace{0.05cm} | \hspace{0.05cm} L}}={2 \cdot E_{\rm B}}/{N_0}\hspace{0.05cm}.$$
Dieses Ergebnis benutzen wir für die folgende Definition:
$\text{Definition:}$ Der Systemwirkungsgrad bei Leistungsbegrenzung einer vorliegenden Konfiguration ist der Quotient aus dem tatsächlichen und dem größtmöglichen Signal–zu–Rausch–Leistungsverhältnis am Entscheider (Detektions–SNR ):
- $$\eta_{\rm L} = \frac{\rho_d}{\rho_{d, \hspace{0.05cm}{\rm max \hspace{0.05cm}\vert \hspace{0.05cm} L} } }= \frac{g_0^2 /\sigma_d^2}{2 \cdot E_{\rm B}/N_0}\hspace{0.05cm}.$$
Nachfolgend wird bewiesen, dass
- die so definierte Größe tatsächlich die Bedingung $0 \le \eta_{\rm L} \le 1$ erfüllt und somit als "Wirkungsgrad" interpretiert werden kann,
- der Wert $\eta_{\rm L} = 1$ dann erreicht wird, wenn die Empfangsfilter–Impulsantwort $h_{\rm E}(t)$ formgleich mit dem Sendegrundimpuls $g_s(t)$ ist.
$\text{Beweis:}$ Der Beweis erfolgt im Frequenzbereich. Aus Darstellungsgründen normieren wir den Sendegrundimpuls:
- $$h_{\rm S}(t) = \frac{g_s(t)}{g_0 \cdot T} \hspace{0.4cm}\circ\!\!-\!\!\!-\!\!\!-\!\!\bullet \hspace{0.4cm} H_{\rm S}(f) = \frac{G_s(f)}{g_0 \cdot T} \hspace{0.05cm}.$$
Damit hat $h_{\rm S}(t)$ die Einheit "$\rm 1/s$" und $H_{\rm S}(f)$ ist dimensionslos. Für die einzelnen Systemgrößen folgt daraus:
(1) Aufgrund des ersten Nyquistkriteriums muss gelten:
- $$ G_d(f) = G_s(f) \cdot H_{\rm E}(f) = G_{\rm Nyq}(f) \hspace{0.3cm} \Rightarrow \hspace{0.3cm} H_{\rm S}(f) \cdot H_{\rm E}(f)= H_{\rm Nyq}(f)= \frac{G_{\rm Nyq}(f)}{g_0 \cdot T}\hspace{0.05cm}.$$
(2) Die Amplitude des Detektionsgrundimpulses ist gleich
- $$g_d(t=0) = g_0 \cdot T \cdot \int_{-\infty}^{+\infty}H_{\rm Nyq}(f) \,{\rm d} f = g_0\hspace{0.05cm}.$$
(3) Die Energie des Sendegrundimpulses ist wie folgt gegeben:
- $$E_{\rm B} = g_0^2 \cdot T^2 \cdot \int_{-\infty}^{+\infty} \vert H_{\rm S}(f)\vert ^2 \,{\rm d} f \hspace{0.05cm}.$$
(4) Die Detektionsstörleistung lautet:
- $$ \sigma_d^2 = \frac{N_0}{2} \cdot \int_{-\infty}^{+\infty} \vert H_{\rm E}(f) \vert^2 \,{\rm d} f = \frac{N_0}{2} \cdot \int_{-\infty}^{+\infty}\frac {\vert H_{\rm Nyq}(f) \vert^2}{\vert H_{\rm S}(f) \vert^2} \,{\rm d} f\hspace{0.05cm}. $$
(5) Setzt man diese Teilergebnisse in die Gleichung für den Systemwirkungsgrad ein, so erhält man:
- $$\eta_{\rm L} = \left [ {T \cdot \int_{-\infty}^{+\infty} \vert H_{\rm S}(f) \vert^2 \,{\rm d} f \hspace{0.2cm} \cdot \hspace{0.2cm}T \cdot \int_{-\infty}^{+\infty}\frac { \vert H_{\rm Nyq}(f) \vert ^2}{ \vert H_{\rm S}(f) \vert^2} \,{\rm d} f } \right ]^{-1}\hspace{0.05cm}.$$
(6) Wir wenden nun auf den Ausdruck in der Klammer die Schwartzsche Ungleichung [BS01][1] an:
- $$\frac{1}{\eta_{\rm L} } = T \cdot \int_{-\infty}^{+\infty} \vert H_{\rm 1}(f) \vert^2 \,{\rm d} f \hspace{0.2cm} \cdot \hspace{0.2cm} T \cdot \int_{-\infty}^{+\infty} \vert H_{\rm 2}(f) \vert^2 \,{\rm d} f \hspace{0.3cm}\ge\hspace{0.3cm} \left [ T \cdot \int_{-\infty}^{+\infty} \vert H_{\rm 1}(f) \cdot H_{\rm 2}(f) \vert \,{\rm d} f \right ]^2$$
- $$\Rightarrow \hspace{0.3cm}\frac{1}{\eta_{\rm L} } = T \cdot \int_{-\infty}^{+\infty} \vert H_{\rm S}(f) \vert^2 \,{\rm d} f \hspace{0.1cm} \cdot \hspace{0.1cm} T \cdot \int_{-\infty}^{+\infty}\frac { \vert H_{\rm Nyq}(f) \vert ^2}{ \vert H_{\rm S}(f) \vert ^2} \,{\rm d} f \hspace{0.2cm}\ge\hspace{0.2cm} \left [ T \cdot \int_{-\infty}^{+\infty}\hspace{-0.5cm}H_{\rm Nyq}(f) \,{\rm d} f \right ]^2 = 1. $$
(7) Damit ist gezeigt, dass der Systemwirkungsgrad bei Leistungsbegrenzung tatsächlich die Bedingung $\eta_{\rm L} \le 1$ erfüllt.
(8) Die Auswertung zeigt, dass für $H_{\rm S, \hspace{0.08cm}opt}(f) = \gamma \cdot \sqrt{H_{\rm Nyq}(f)}$ in obiger Ungleichung das Gleichheitszeichen gilt:
- $$\gamma^2 \cdot T \cdot \int_{-\infty}^{+\infty}\hspace{-0.3cm} H_{\rm Nyq}(f) \,{\rm d} f \hspace{0.2cm} \cdot \hspace{0.2cm} \frac {1}{\gamma^2} \cdot T \cdot \int_{-\infty}^{+\infty} \hspace{-0.3cm}H_{\rm Nyq}(f) \,{\rm d} f = \left [ T \cdot \int_{-\infty}^{+\infty}\hspace{-0.3cm}H_{\rm Nyq}(f) \,{\rm d} f \right ]^2 = 1 \hspace{0.3cm} \Rightarrow \hspace{0.3cm} \eta_{\rm L} = 1 \hspace{0.05cm}.$$
(9) Dieses Ergebnis ist unabhängig vom Parameter $\gamma$, den wir deshalb vereinfachend zu $\gamma = 1$ setzen: $H_{\rm S, \hspace{0.08cm}opt}(f) = \sqrt{H_{\rm Nyq}(f)}$.
Wurzel–Nyquist–Systeme
Das wesentliche Ergebnis der Berechnungen auf den letzten Seiten war, dass beim optimalen Binärsystem unter der Nebenbedingung Leistungsbegrenzung
- der Detektionsgrundimpuls $g_d(t) = g_s(t) \star h_{\rm E}(t)$ die erste Nyquistbedingung erfüllen muss, und
- die Impulsantwort $h_{\rm E}(t)$ des Empfangsfilters formgleich mit dem Sendegrundimpuls $g_s(t)$ zu wählen ist; gleiches gilt für die Spektralfunktionen $H_{\rm E}(f)$ und $G_s(f)$.
Sind sowohl $g_s(t)$ als auch $h_{\rm E}(t)$ rechteckförmig mit $T_{\rm S} = T_{\rm E} \le T$, so werden beide Bedingungen erfüllt.
- Nachteil dieser Konfiguration ist allerdings der große Bandbreitenbedarf aufgrund der nur langsam abfallenden, $\rm si$–förmigen Spektralfunktionen $G_s(f)$ und $H_{\rm E}(f)$.
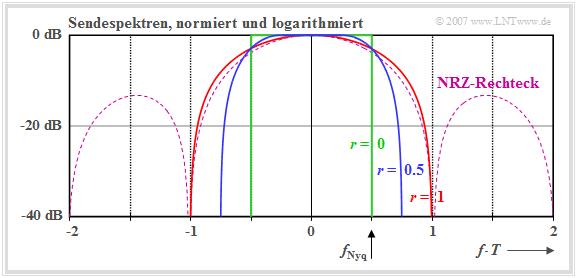
- In der unteren Grafik ist die Spektralfunktion des rechteckförmigen NRZ–Sendegrundimpulses als gestrichelte violette Kurve eingezeichnet.
Geht man von einem Nyquistspektrum mit Cosinus–Rolloff–Flanke ⇒ $H_{\rm E}(f) = H_{\rm CRO}(f)$ aus,
- $$G_d(f) = G_s(f) \cdot H_{\rm E}(f) = g_0 \cdot T \cdot {H_{\rm CRO}(f)} \hspace{0.3cm} \Rightarrow \hspace{0.3cm}G_s(f) = g_0 \cdot T \cdot \sqrt{H_{\rm CRO}(f)},\hspace{0.5cm}H_{\rm E}(f)= \sqrt{H_{\rm CRO}(f)}\hspace{0.05cm},$$
so ergeben sich für jeden Rolloff–Faktor $r$ günstigere Spektraleigenschaften und ein geringerer Bandbreitenbedarf.
Die folgende Grafik zeigt die normierten Sendespektren $G_s(f)/(g_0 \cdot T)$ in logarithmierter Darstellung für die drei Rolloff–Faktoren
- $r = 0$ (grüne Kurve),
- $r = 0.5$ (blaue Kurve), und
- $r = 1$ (rote Kurve).
Anmerkungen:
- Bei der Basisbandübertragung spielt der Bandbreitenbedarf nur eine untergeordnete Rolle.
- Die Grafik gilt aber auch für Trägerfrequenzsysteme bei Darstellung im äquivalenten Tiefpassbereich.
- Bei diesen Systemen spielt die Bandbreite eine sehr wichtige Rolle. Denn: Jedes zusätzliches Hertz an Bandbreite kann sehr teuer sein.
Systemoptimierung bei Spitzenwertbegrenzung
Die Systemoptimierung hängt beim AWGN–Kanal mit der (einseitigen) Rauschleistungsdichte $N_0$ in starkem Maße davon ab, welche Nebenbedingung festgelegt wird:
- Bei Leistungsbegrenzung (gekennzeichnet durch den Index "L") darf die Energie des Sendegrundimpulses $g_s(t)$ einen vorgegebenen Wert $E_{\rm B}$ nicht überschreiten. Hier gilt für die minimale Bitfehlerwahrscheinlichkeit und das maximale SNR:
- $$p_{\rm B, \hspace{0.08cm}min} = {\rm Q} \left( \sqrt{\rho_{d, \hspace{0.05cm}{\rm max \hspace{0.05cm} | \hspace{0.05cm} L}}}\right)\hspace{0.5cm}{\rm mit}\hspace{0.5cm} \rho_{d, \hspace{0.05cm}{\rm max \hspace{0.05cm} | \hspace{0.05cm} L}}={2 \cdot E_{\rm B}}/{N_0}\hspace{0.05cm}.$$
- Bei Spitzenwertbegrenzung (oder Amplitudenbegrenzung, gekennzeichnet durch den Index "A") ist dagegen der Aussteuerbereich der Sendeeinrichtung begrenzt ⇒ $\vert s(t) \vert \le s_0\hspace{0.4cm}{\rm{f\ddot{u}r} }\hspace{0.15cm}{\rm alle}\hspace{0.15cm}t$. Hier gilt für die entsprechenden Größen:
- $$p_{\rm B, \hspace{0.08cm}min} = {\rm Q} \left( \sqrt{\rho_{d, \hspace{0.05cm}{\rm max \hspace{0.05cm} | \hspace{0.05cm}A}}}\right)\hspace{0.5cm}{\rm mit}\hspace{0.5cm} \rho_{d, \hspace{0.05cm}{\rm max \hspace{0.05cm} | \hspace{0.05cm}A}}={2 \cdot s_0^2 \cdot T}/{N_0}\hspace{0.05cm}.$$
Für diesen zweiten Fall legen wir fest:
$\text{Definition:}$ Der Systemwirkungsgrad bei Amplitudenbegrenzung (Spitzenwertbegrenzung) lautet:
- $$\eta_{\rm A} = \frac{\rho_d}{\rho_{d, \hspace{0.05cm}{\rm max \hspace{0.05cm}\vert \hspace{0.05cm} A} } }= \frac{g_0^2 /\sigma_d^2}{ 2 \cdot s_0^2 \cdot T/N_0}\hspace{0.05cm}.$$
- Auch dieser Systemwirkungsgrad erfüllt die Bedingung $0 \le \eta_{\rm A} \le 1$.
- Es gibt nur ein einziges System mit dem Ergebnis $\eta_{\rm A} = 1$: Der NRZ–Rechteck–Sendegrundimpuls und das daran angepasste Empfangsfilter.
Ein Vergleich mit dem Systemwirkungsgrad bei Leistungsbegrenzung ⇒ $\eta_{\rm L}$ zeigt:
- $\eta_{\rm A}$ unterscheidet sich von $\eta_{\rm L}$ dadurch, dass nun im Nenner $s_0^2 \cdot T$ anstelle von $E_{\rm B}$ steht. Es gilt folgender Zusammenhang:
- $$\eta_{\rm A} = \frac{E_{\rm B}}{s_0^2 \cdot T} \cdot \eta_{\rm L}= \frac{\eta_{\rm L}}{C_{\rm S}^2}\hspace{0.05cm}.$$
- Hierbei bezeichnet der Scheitelfaktor $C_{\rm S}$ (englisch: Crestfaktor ) das Verhältnis von Maximalwert $s_0$ und Effektivwert $s_{\rm eff}$ des Sendesignals:
- $$C_{\rm S} = \frac{s_0}{\sqrt{E_{\rm B}/T}} = \frac{{\rm Max}[s(t)]}{\sqrt{{\rm E}[s^2(t)]}}= \frac{s_0}{s_{\rm eff}} \hspace{0.3cm} \Rightarrow \hspace{0.3cm} s_{\rm eff} = \sqrt {E_{\rm B}/T}.$$
$\text{Beispiel 3:}$ Wir betrachten wie im $\text{Beispiel 1}$ drei unterschiedliche Konfigurationen mit jeweils rechteckförmigen Zeitfunktionen $g_s(t)$ und $h_{\rm E}(t)$ und geben hierfür die Systemwirkungsgrade an:
- $\text{System A:}$ $\rho_d = {2 \cdot E_{\rm B} }/{N_0} = { 2 \cdot s_0^2 \cdot T}/{N_0}\hspace{0.3cm}\Rightarrow \hspace{0.3cm}\eta_{\rm L} = 1.0,\hspace{0.3cm}\eta_{\rm A} = 1.0\hspace{0.05cm}.$
- $\text{System B:}$ $\rho_d = {E_{\rm B} }/{N_0} ={ s_0^2 \cdot T}/{N_0}\hspace{1.35cm}\Rightarrow \hspace{0.3cm}\eta_{\rm L} = 0.5,\hspace{0.3cm}\eta_{\rm A} = 0.5\hspace{0.05cm}.$
- $\text{System C:}$ $\rho_d = {2 \cdot E_{\rm B} }/{N_0} = { s_0^2 \cdot T}/{N_0}\hspace{0.8cm}\Rightarrow \hspace{0.3cm}\eta_{\rm L} = 1.0,\hspace{0.3cm}\eta_{\rm A} = 0.5\hspace{0.05cm}.$
Man erkennt:
- Beim $\text{System B}$ sind beide Systemwirkungsgrade aufgrund der fehlenden Anpassung $(T_{\rm E} \ne T_{\rm S})$ nur jeweils $0.5$.
- Beim $\text{System C}$ hat zwar der Systemwirkungsgrad $\eta_{\rm L}$ wegen $T_{\rm E} = T_{\rm S}$ den Maximalwert $\eta_{\rm L} = 1$.
- Dagegen ist $\eta_{\rm A} = 0.5$, da der RZ–Impuls nicht die maximale Energie besitzt, die aufgrund der Spitzenwertbegrenzung erlaubt wäre.
- Der Crestfaktor hat hier den Wert $C_{\rm S} = \sqrt{2}$.
$\text{Beispiel 4:}$ Nun betrachten wir eine Wurzel–Nyquist–Konfiguration mit Cosinus–Rolloff–Gesamtfrequenzgang:
- $$G_s(f) = g_0 \cdot T \cdot \sqrt{H_{\rm CRO}(f)},\hspace{0.5cm}H_{\rm E}(f)= \sqrt{H_{\rm CRO}(f)} \hspace{0.3cm} \Rightarrow \hspace{0.3cm} G_d(f) = g_0 \cdot T \cdot {H_{\rm CRO}(f)} = G_{\rm Nyq}(f)\hspace{0.05cm}.$$
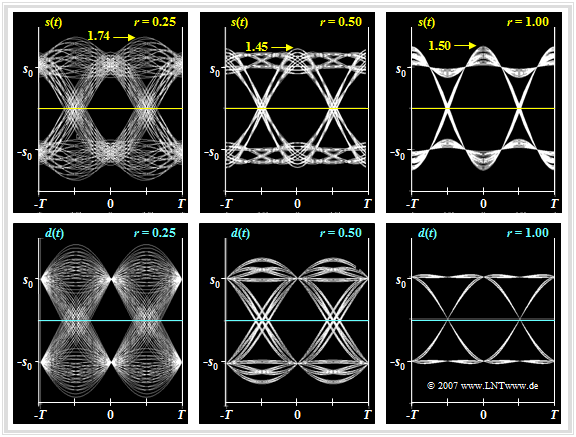
Die Grafik zeigt die Augendiagramme am Sender (oben) und am Empfänger (unten), jeweils für die Rolloff–Faktoren $r = 0.25$, $r = 0.5$ und $r = 0.1$. Es sei daran erinnert, dass eine solche Konfiguration unter der Nebenbedingung der Leistungsbegrenzung unabhängig vom Rolloff–Faktor $r$ optimal ist: $\eta_{\rm L} = 1$.
Man erkennt aus dieser Darstellung:
- Der Sendeimpuls $g_s(t)$ erfüllt nicht die Nyquistbedingung: Das Auge am Sender (obere Bildreihe) ist nicht vollständig geöffnet und der Maximalwert des Sendesignals ist größer als sein Effektivwert.
- Der Crestfaktor $C_{\rm S} = s_0/s_{\rm eff}$ wird mit kleinerem $r$ größer und damit der Wirkungsgrad $\eta_{\rm A} $ kleiner. Für $r = 0.5$ ergibt sich $C_{\rm S} \approx 1.45$ und damit $\eta_{\rm A} \approx 0.47$. Das Detektions–SNR ist dann um den Betrag $10 \cdot \lg \ \eta_{\rm A} \approx 3.2 \ \rm dB$ geringer als bei der Rechteck–Rechteck–Konfiguration.
- Im Grenzfall $r = 0$ gilt sogar $C_{\rm S} \to \infty$ und $\eta_{\rm A} \to 0$. Der Sendegrundimpuls $g_s(t)$ fällt hier noch langsamer als mit $1/t$ ab, und es gilt:
- $$\max_t\{ s(t) \} = \max_t \hspace{0.15cm}\left [ \sum_{(\nu)} a_\nu \cdot g_s ( t - \nu \cdot T)\ \right ]\rightarrow \infty\hspace{0.05cm}.$$
- Begrenzt man das Sendesignal $s(t)$ durch einen gegen Null gehenden Gewichtungsfaktor auf einen endlichen Maximalwert $s_0$, so führt dies zu einem geschlossenem Auge vor dem Entscheider.
Optimierung des Rolloff–Faktors bei Spitzenwertbegrenzung
Für dieses Kapitel wird von folgenden Voraussetzungen ausgegangen:
- Der Sendegrundimpuls $g_s(t)$ sei NRZ–rechteckförmig; bei Spitzenwertbegrenzung ist dies optimal.
- Der Gesamtfrequenzgang $H_{\rm S}(f) \cdot H_{\rm E}(f) =\sqrt{H_{\rm Nyq}(f)}$ erfülle die Nyquistbedingung.
- Der Nyquistfrequenzgang werde durch einen Cosinus–Rolloff–Tiefpass realisiert: $H_{\rm Nyq}(f) = H_{\rm CRO}(f)$.
- Da die Impulsamplitude $g_0$ unabhängig vom Rolloff–Faktor $r$ ist, lässt sich die SNR–Maximierung auf die Minimierung der Rauschleistung am Entscheider zurückführen:
- $$\sigma_d^2 = \frac{N_0}{2} \cdot \int_{-\infty}^{+\infty}|H_{\rm E}(f)|^2 \,{\rm d} f\hspace{0.3cm}\Rightarrow \hspace{0.3cm}{\rm Minimum,} \hspace{0.5cm}{\rm wobei}\hspace{0.5cm} H_{\rm E}(f) =\frac {H_{\rm CRO}(f)}{{\rm si}(\pi f T)}\hspace{0.05cm}.$$
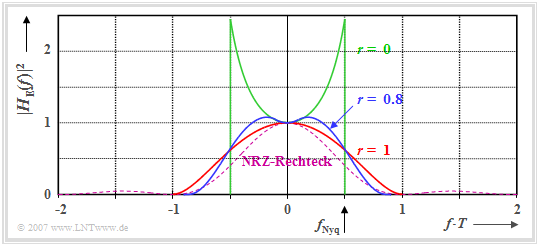
Die Grafik zeigt die Leistungsübertragungsfunktion $|H_{\rm E}(f)|^2$ für drei verschiedene Rolloff–Faktoren. Die Flächen unter diesen Kurven sind jeweils ein Maß für die Rauschleistung $\sigma_d^2$ vor dem Entscheider. Man erkennt aus dieser Darstellung:
- Der Rolloff–Faktor $r = 0$ (Rechteck–Frequenzgang) führt trotz des sehr schmalbandigen Empfangsfilters nur zum Wirkungsgrad $\eta_{\rm A} \approx 0.65$, da $H_{\rm E}(f)$ wegen der $\rm si$-Funktion im Nenner mit wachsendem $f$ ansteigt.
- $r = 1$ bewirkt zwar ein doppelt so breites Spektrum, führt aber zu keiner Anhebung. Da die Fläche unter der roten Kurve kleiner ist als die unter der grünen, ergibt sich ein besserer Wert: $\eta_{\rm A} \approx 0.88$.
- Der größte Systemwirkungsgrad ergibt sich für $r \approx 0.8$ (flaches Maximum) mit $\eta_{\rm A} \approx 0.89$. Hierfür erreicht man den bestmöglichen Kompromiss zwischen Bandbreite und Überhöhung.
- Durch Vergleich mit dem optimalen Frequenzgang $H_{\rm E}(f) = {\rm si}(\pi f T)$ bei Spitzenwertbegrenzung, der zum Ergebnis $\sigma_d^2 = N_0/(2T)$ ⇒ $\eta_{\rm A}= 1$ führt, erhält man für den Systemwirkungsgrad:
- $$\eta_{\rm A} = \left [T \cdot \int_{-\infty}^{+\infty}\hspace{-0.15cm} |H_{\rm E}(f)|^2 \,{\rm d} f \right ]^{-1} \hspace{0.05cm}.$$
$\text{Fazit:}$
- Das absolute Optimum bei Spitzenwertbegrenzzung ⇒ $\eta_{\rm A}= 1$ ergibt sich nur mit einem rechteckförmigen Sendegrundimpuls $g_s(t)$ und einer ebenfalls rechteckförmigen Empfangsfilter–Impulsantwort $h_{\rm E}(t)$ gleicher Breite $T$.
- Das beste Cosinus-Rolloff-Nyquistspektrum mit $r = 0.8$ (blaue Kurve) ist gegenüber dem Matched-Filter (violett-gestrichelte Kurve) um ca. $0.5 \ \rm dB$ schlechter, da die Fläche unter der blauen Kurve um ca. $12\%$ größer ist als die Fläche unter der violetten Kurve.
- Die so genannte Wurzel–Wurzel–Konfiguration ⇒ $H_{\rm S}(f) \cdot H_{\rm E}(f) =\sqrt{H_{\rm CRO}(f)}$ macht also nur Sinn, wenn man von Leistungsbegrenzung ausgeht.
Exercises for the chapter
Aufgabe 1.6: Wurzel–Nyquist–System
Aufgabe 1.6Z: Zwei Optimalsysteme
Aufgabe 1.7: Systemwirkungsgrade
References
- ↑ Bronstein, I.N.; Semendjajew, K.A.: Taschenbuch der Mathematik. 5. Auflage. Frankfurt: Harry Deutsch, 2001.


