- [[Linear and Time Invariant Systems/{{{Vorherige Seite}}} | Previous page]]
- [[Linear and Time Invariant Systems/{{{Vorherige Seite}}} | Previous page]]
Contents
- 1 # OVERVIEW OF THE FIRST MAIN CHAPTER #
- 2 The Cause-Effect Principle
- 3 Application in Communications Engineering
- 4 Prerequisites for the Application of Systems Theory
- 5 Transfer function – Frequency response
- 6 Properties of the Frequency Response
- 7 Tiefpass, Hochpass, Bandpass und Bandsperre
- 8 Testsignale zur Messung des Frequenzgangs
- 9 Aufgaben zum Kapitel
# OVERVIEW OF THE FIRST MAIN CHAPTER #
In the book "Signal Representation" you were familiarised with the mathematical description of deterministic signals in the time and frequency domain. The second book "Linear Time-Invariant Systems" now describes which changes a signal or its spectrum undergoes through an information system and how these changes can be captured mathematically.
$\text{Please note:}$
- The "system" can be a simple circuit as well as a complete, highly complicated transmission system with a multitude of components.
- It is only assumed here that the system has the two properties ”linear” and ”time-invariant”.
In the first chapter, the basics of the so-called systems theory are mentioned, which allows a uniform and simple description of such systems. We start with the system description in the frequency domain with the partial aspects listed above.
Further information on the topic as well as tasks, simulations and programming exercises can be found in
- Chapter 6: Linear Time-Invariant Systems (Programme lzi)
of the practical course "Simulation Methods in Communications Engineering". This (former) LNT course at the TU Munich is based on
- the educational software package LNTsim ⇒ Link refers to the ZIP version of the programme, and
- this practical course guide Praktikumsanleitung ⇒ Link refers to the PDF-version; Chapter 6: pages 99-118.
The Cause-Effect Principle
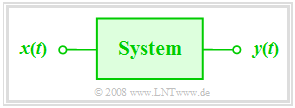
In this chapter we always consider the simple model outlined on the right.
This arrangement is to be interpreted as follows:
- The focus is on the so-called system, which is largely abstracted in its function ("black box"). Nothing is known in detail about the realisation of the system.
- The time-dependent input variable $x(t)$ acting on this system is also referred to as the cause function in the following.
- At the output of the system, the effect function $y(t)$ then appears - quasi as a response of the system to the input function $x(t)$.
Note: the system can generally be of any kind and is not limited to communications technology alone. Rather, attempts are also made in other fields of science, such as the natural sciences, economics and business administration, sociology and political science, to capture and describe causal relationships between different variables by means of the cause-effect principle.
However, the methods used for these phenomenological system theories differ significantly from the approach in communications engineering, which is outlined in this first main chapter of the present book "Linear Time-Invariant Systems".
Application in Communications Engineering
The cause-effect principle can also be applied in communications engineering, for example to describe two-poles. Here one can consider the current curve $i(t)$ as a cause function and the voltage $u(t)$ as an effect function. By observing the I/U relationships, conclusions can be drawn about the properties of the actually unknown two-pole.
Karl Küpfmüller introduced the term "systems theory" for the first time (in Germany) in 1949. He considers it as a method for describing complex causal relationships in natural sciences and technology, based on a spectral transformation - for example, the Fouriertransformation presented in the book "Signal Representation".
An information system can entirely be described in therms of systems theory. Here
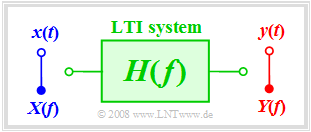
- the cause function is the input signal $x(t)$ or its spectrum $X(f)$,
- the response function is the output signal $y(t)$ or its spectrum $Y(f)$.
Also in the following pictures, the input variables are mostly drawn in blue, the output variables in red and system variables in green.
$\text{Example 1:}$ If the "information system" describes a given linear circuit, then given a known input signal $x(t)$ the output signal $y(t)$ can be predicted with the help of systems theory. A second task of systems theory is to classify the information system by measuring $y(t)$ knowing $x(t)$ but without knowing the system in detail.
If $x(t)$ describes, for instance, the voice of a caller in Hamburg and $y(t)$ the recording of an answering machine in Munich, then the "information system" consists of the following components:
microphone – telephone – electrical line – signal converter – fibre optic cable – optical amplifier – signal resetter – receive filter (for example for equalisation and noise limitation) – ... – electromagnetic transducer.
Prerequisites for the Application of Systems Theory
The model of a messaging or information system given above holds generally and independently of the boundary conditions. However, the application of systems theory requires some additional limiting preconditions.
Unless explicitly stated otherwise, the following shall always apply:
- Both $x(t)$ and $y(t)$ are deterministic signals. Otherwise, one must proceed according to the page Stochastische Systemtheorie in the book "Theory of Stochastic Signals".
- The system is linear. This can be seen, for example, from the fact that a harmonic oscillation $x(t)$ at the input also results in a harmonic oscillation $y(t)$ of the same frequency at the output:
- $$x(t) = A_x \cdot \cos(\omega_0 \hspace{0.05cm}t - \varphi_x)\hspace{0.2cm}\Rightarrow \hspace{0.2cm} y(t) = A_y \cdot\cos(\omega_0 \hspace{0.05cm}t - \varphi_y).$$
- New frequencies do not arise. Only amplitude and phase of the harmonic oscillation can be changed. Non-linear systems are treated in the chapter Nichtlineare Verzerrungen .
- Because of linearity, the superposition principle is also applicable. This states that due to $x_1(t) ⇒ y_1(t)$ and $x_2(t) ⇒ y_2(t)$ the following mapping also necessarily holds:
- $$x_1(t) + x_2(t) \hspace{0.1cm}\Rightarrow \hspace{0.1cm} y_1(t) + y_2(t).$$
- The system is time-invariant. This means that an input signal shifted by $\tau$ results in the same output signal – but this is also delayed by $\tau$ :
- $$x(t - \tau) \hspace{0.1cm}\Rightarrow \hspace{0.1cm} y(t -\tau)\hspace{0.4cm}{\rm falls} \hspace{0.4cm}x(t )\hspace{0.2cm}\Rightarrow \hspace{0.1cm} y(t).$$
- Time-varying systems are discussed in the book Mobile Kommunikation .
If all the conditions listed here are fulfilled, one deals with a linear time-invariant system, abbreviated LTI–system. In the German-language literature the abbreviation LZI (linear zeitinvariant) is commonly used.
Transfer function – Frequency response
We assume an LTI-system whose input and output spectra $X(f)$ and $Y(f)$ are known or can be derived from the time signals $x(t)$ and $y(t)$ via Fouriertransformation .
$\text{Definition:}$ The transmission behaviour of a messaging system is described in the frequency domain by the transfer function :
- $$H(f) = \frac{Y(f)}{X(f)}= \frac{ {\rm response\:function} }{ {\rm cause\:function} }.$$
Other terms for $H(f)$ are "system function" and "frequency response". In the following we will mainly use the latter.
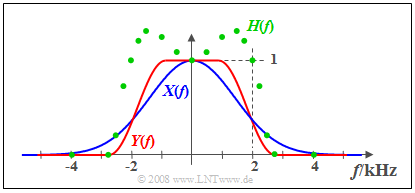
$\text{Example 2:}$ The signal $x(t)$ with the real spectrum $X(f)$ (blue curve) is applied to the input of an LTI-system. The measured output spectrum $Y(f)$ – marked red in the graph – is larger than $X(f)$ at frequencies lower than $2 \ \rm kHz$ and has a steeper slope in the region around $2 \ \rm kHz$ . Above $2.8 \ \rm kHz$ the signal $y(t)$ has no spectral components.
- The green circles mark some measuring points of the frequency response
- $$H(f) = Y(f)/X(f)$$ which is real, too.
- At low frequencies $H(f)>1$: In this range the LTI-system has an amplifying effect.
- The frequency roll-off of $H(f)$ is similar to that of $Y(f)$ but not identical.
Properties of the Frequency Response
The frequency response $H(f)$ is a central variable in the description of communication systems.
Some properties of this important system variable are listed below:
- The frequency response describes the LTI–system on its own. It can be calculated, for example, from the linear components of an electrical network. Bei anderem Eingangssignal $x(t)$ und dementsprechend anderem Ausgangssignal $y(t)$ ergibt sich der genau gleiche Frequenzgang $H(f)$.
- $H(f)$ kann eine „Einheit” besitzen. Betrachtet man zum Beispiel bei einem Zweipol den Spannungsverlauf $u(t)$ als Ursache und den Strom $i(t)$ als Wirkung, so hat der Frequenzgang $H(f) = I(f)/U(f)$ die Einheit $\rm A/V$. $I(f)$ und $U(f)$ sind die Fouriertransformierten von $i(t)$ bzw. $u(t)$.
- Im Folgenden betrachten wir ausschließlich Vierpole. Zudem setzen wir ohne Einschränkung der Allgemeingültigkeit meist voraus, dass $x(t)$ und $y(t)$ jeweils Spannungen seien. In diesem Fall ist $H(f)$ stets dimensionslos.
- Da die Spektren $X(f)$ und $Y(f)$ im allgemeinen komplex sind, ist auch der Frequenzgang $H(f)$ eine komplexe Funktion. Man nennt den Betrag $|H(f)|$ den Amplitudengang. Dieser wird auch oft in logarithmierter Form dargestellt und als Dämpfungsverlauf bezeichnet:
- $$a(f) = - \ln |H(f)| = - 20 \cdot \lg |H(f)|.$$
- Je nachdem, ob die erste Form mit dem natürlichen oder die zweite mit dekadischem Logarithmus verwendet wird, ist die Pseudoeinheit „Neper” (Np) bzw. „Dezibel” (dB) hinzuzufügen.
- Der Phasengang ist aus $H(f)$ in folgender Weise berechenbar:
- $$b(f) = - {\rm arc} \hspace{0.1cm}H(f) \hspace{0.2cm}{\rm in\hspace{0.1cm}Radian \hspace{0.1cm}(rad)}.$$
Damit kann der gesamte Frequenzgang auch wie folgt dargestellt werden:
- $$H(f) = \vert H(f)\vert \cdot {\rm e}^{ - {\rm j} \hspace{0.05cm} \cdot\hspace{0.05cm} b(f)} = {\rm e}^{-a(f)}\cdot {\rm e}^{ - {\rm j}\hspace{0.05cm} \cdot \hspace{0.05cm} b(f)}.$$
Tiefpass, Hochpass, Bandpass und Bandsperre
Nach dem Amplitudengang $|H(f)|$ unterscheidet man zwischen
- Tiefpass: Signalanteile werden mit zunehmender Frequenz in der Tendenz stärker gedämpft.
- Hochpass: Hier werden hochfrequente Signalanteile weniger gedämpft als niederfrequente. Ein Gleichsignal $($also ein Signalanteil mit der Frequenz $f = 0)$ kann über einen Hochpass nicht übertragen werden.
- Bandpass: Es gibt eine bevorzugte Frequenz, die man als Mittenfrequenz $f_{\rm M}$ bezeichnet. Je weiter die Frequenz eines Signalanteils von $f_{\rm M}$ entfernt ist, um so stärker wird dieser gedämpft.
- Bandsperre: Dies ist das Gegenstück zum Bandpass und es gilt $|H(f_{\rm M})| ≈ 0$. Sehr niederfrequente und sehr hochfrequente Signalanteile werden dagegen gut durchgelassen.
Die Grafik zeigt die Amplitudengänge der Filtertypen „Tiefpass” (TP) und „Hochpass” (HP) (links) sowie „Bandpass” (BP) (rechts).
- Ebenfalls eingezeichnet sind die Grenzfrequenzen $f_{\rm G}$ (bei Tiefpass und Hochpass) bzw. $f_{\rm U}$ und $f_{\rm O}$ (beim Bandpass).
- Diese bezeichnen hier 3dB–Grenzfrequenzen, zum Beispiel gemäß der folgenden Definition.
$\text{Definition:}$ Die 3dB–Grenzfrequenz eines Tiefpasses gibt diejenige Frequenz $f_{\rm G}$ an, für die gilt:
- $$\vert H(f = f_{\rm G})\vert = {1}/{\sqrt{2} } \cdot \vert H(f = 0)\vert \hspace{0.5cm}\Rightarrow\hspace{0.5cm} \vert H(f = f_{\rm G})\vert^2 = {1}/{2} \cdot \vert H(f = 0) \vert^2.$$
- Anzumerken ist, dass es für die Grenzfrequenz auch eine Reihe anderer Definitionen gibt.
- Diese finden Sie auf der Seite Allgemeine Bemerkungen im Kapitel „Einige systemtheoretische Tiefpassfunktionen” .
Testsignale zur Messung des Frequenzgangs
Zur messtechnischen Erfassung des Frequenzgangs $H(f)$ eignet sich jedes beliebige Eingangssignal $x(t)$ mit Spektrum $X(f)$, solange $X(f)$ keine Nullstelle (im interessierenden Bereich) aufweist. Durch Messung des Ausgangsspektrums $Y(f)$ lässt sich so der Frequenzgang in einfacher Weise ermitteln:
- $$H(f) = \frac{Y(f)}{X(f)}.$$
Insbesondere sind folgende Eingangssignale geeignet:
- Diracimpuls $x(t) = K · δ(t)$ ⇒ Spektrum $X(f) = K$:
- Somit ist der Frequenzgang nach Betrag und Phase formgleich mit dem Ausgangsspektrum $Y(f)$ und es gilt $H(f) = 1/K · Y(f)$. Approximiert man den Diracimpuls durch ein schmales Rechteck gleicher Fläche $K$, so muss $H(f)$ mit Hilfe einer ${\rm sin}(x)/x$–Funktion korrigiert werden.
- Diracpuls – die unendliche Summe gleichgewichteter Diracimpulse im zeitlichen Abstand $T_{\rm A}$:
- Dieser führt gemäß dem Kapitel Zeitdiskrete Signaldarstellung im Buch „Signaldarstellung” zu einem Diracpuls im Frequenzbereich mit Abstand $f_{\rm A} =1/T_{\rm A}$. Damit ist eine frequenzdiskrete Messung von $H(f)$ möglich, mit den spektralen Abtastwerten im Abstand $f_{\rm A}$.
- Harmonische Schwingung $x(t) = A_x · \cos (2πf_0t - φ_x)$ ⇒ diracförmiges Spektrum bei $\pm f_0$:
- Das Ausgangssignal $y(t) = A_y · \cos(2πf_0t - φ_y)$ ist eine Schwingung mit gleicher Frequenz $f_0$. Der Frequenzgang lautet für $f_0 \gt 0$:
- $$H(f_0) = \frac{Y(f_0)}{X(f_0)} = \frac{A_y}{A_x}\cdot{\rm e}^{\hspace{0.05cm} {\rm j} \hspace{0.05cm} \cdot \hspace{0.05cm} (\varphi_x - \varphi_y)}.$$
- Zur Ermittlung des gesamten Frequenzgangs $H(f)$ sind (unendlich) viele Messungen mit verschiedenen Frequenzen $f_0$ erforderlich.
Aufgaben zum Kapitel
Aufgabe 1.1: Einfache Filterfunktionen
Aufgabe 1.1Z: Tiefpass 1. und 2. Ordnung
Aufgabe 1.2Z: Messung der Übertragungsfunktion


