Difference between revisions of "Signal Representation/Analytical Signal and its Spectral Function"
| Line 16: | Line 16: | ||
X(f) \; \hspace{0.2cm}\rm for\hspace{0.2cm} {\it f} > 0, \atop {\,\,\,\, \rm 0 \; \hspace{0.9cm}\rm for\hspace{0.2cm} {\it f} < 0.} }\right.$$ | X(f) \; \hspace{0.2cm}\rm for\hspace{0.2cm} {\it f} > 0, \atop {\,\,\,\, \rm 0 \; \hspace{0.9cm}\rm for\hspace{0.2cm} {\it f} < 0.} }\right.$$ | ||
| − | The $\text{ | + | The $\text{sign function}$ is for positive $f$–values equal to $+1$ and for negative $f$-values equal to $-1$. |
*The (double sided) limit value returns $\sign(0) = 0$. | *The (double sided) limit value returns $\sign(0) = 0$. | ||
*The index "+" should make clear that $X_+(f)$ has only parts at positive frequencies. | *The index "+" should make clear that $X_+(f)$ has only parts at positive frequencies. | ||
| Line 75: | Line 75: | ||
==Representation with Hilbert transform== | ==Representation with Hilbert transform== | ||
<br> | <br> | ||
| − | At this point it is necessary to briefly discuss a further spectral transformation, which is dealt thoroughly in the book [[Linear_and_Time_Invariant_Systems/Folgerungen_aus_dem_Zuordnungssatz#Hilbert.E2.80.93Transformation|Linear and Time | + | At this point it is necessary to briefly discuss a further spectral transformation, which is dealt thoroughly in the book [[Linear_and_Time_Invariant_Systems/Folgerungen_aus_dem_Zuordnungssatz#Hilbert.E2.80.93Transformation|Linear and Time-invariant Systems]] . |
{{BlaueBox|TEXT= | {{BlaueBox|TEXT= | ||
| − | $\text{Definition:}$ | + | $\text{Definition:}$ For the $\text{Hilbert transform}$ $ {\rm H}\left\{x(t)\right\}$ of a time function $x(t)$ applies: |
:$$y(t) = {\rm H}\left\{x(t)\right\} = \frac{1}{ {\rm \pi} } \cdot | :$$y(t) = {\rm H}\left\{x(t)\right\} = \frac{1}{ {\rm \pi} } \cdot | ||
| Line 83: | Line 83: | ||
\tau} }\hspace{0.15cm} {\rm d}\tau.$$ | \tau} }\hspace{0.15cm} {\rm d}\tau.$$ | ||
| − | *This particular integral cannot be solved in a simple, conventional way, but must be evaluated using the [https://en.wikipedia.org/wiki/Cauchy_principal_value | + | *This particular integral cannot be solved in a simple, conventional way, but must be evaluated using the [https://en.wikipedia.org/wiki/Cauchy_principal_value "Principal Value of Cauchy"]. |
*Correspondingly valid in the frequency domain: | *Correspondingly valid in the frequency domain: | ||
| Line 95: | Line 95: | ||
:$$x_+(t) = x(t)+{\rm j} \cdot {\rm H}\left\{x(t)\right\} .$$ | :$$x_+(t) = x(t)+{\rm j} \cdot {\rm H}\left\{x(t)\right\} .$$ | ||
| − | *The Hilbert | + | *The Hilbert transform $\text{H}\{x(t)\}$ disappears only in the case of $x(t) = \rm const.$ ⇒ DC signal. With all other signal forms the analytic signal $x_+(t)$ is always complex. |
*From the analytical signal $x_+(t)$ the real band-pass signal can be easily determined by real part formation: | *From the analytical signal $x_+(t)$ the real band-pass signal can be easily determined by real part formation: | ||
:$$x(t) = {\rm Re}\left\{x_+(t)\right\} .$$ | :$$x(t) = {\rm Re}\left\{x_+(t)\right\} .$$ | ||
{{GraueBox|TEXT= | {{GraueBox|TEXT= | ||
| − | $\text{Example 2:}$ The principle of the Hilbert transformation is illustrated | + | $\text{Example 2:}$ The principle of the Hilbert transformation is illustrated here by the following diagram: |
| − | + | *According to the left representation $\rm (A)$, one gets the analytical signal $x_+(t)$ from the physical signal $x(t)$ by adding an imaginary part ${\rm j} \cdot y(t)$. | |
| − | *Here $y(t) = {\rm H}\left\{x(t)\right\}$ is a real time function, which can be calculated easily in the spectral range by multiplying the spectrum $X(f)$ with $- {\rm j} \cdot \sign(f)$ | + | *Here $y(t) = {\rm H}\left\{x(t)\right\}$ is a real time function, which can be calculated easily in the spectral range by multiplying the spectrum $X(f)$ with $- {\rm j} \cdot \sign(f)$. |
| − | [[File:P_ID2729__Sig_T_4_2_S2b_neu.png| | + | [[File:P_ID2729__Sig_T_4_2_S2b_neu.png|right|frame|Illustration of the Hilbert Transform]] |
| + | |||
| + | <br><br><br> | ||
| + | The right representation $\rm (B)$ is equivalent to $\rm (A)$: | ||
| + | *With the imaginary function $z(t)$ one obtains: | ||
| + | :$$x_+(t) = x(t) + z(t).$$ | ||
| + | *A comparison of both models shows that it is indeed true: | ||
| + | :$$z(t) = {\rm j} \cdot y(t).$$}} | ||
| − | |||
| − | |||
| − | |||
| Line 130: | Line 134: | ||
This equation describes a rotating pointer with constant angular velocity $\omega_{\rm T} = 2\pi f_{\rm T}$ . | This equation describes a rotating pointer with constant angular velocity $\omega_{\rm T} = 2\pi f_{\rm T}$ . | ||
{{GraueBox|TEXT= | {{GraueBox|TEXT= | ||
| − | $\text{Example 3:}$ For illustrative reasons the coordinate system | + | $\text{Example 3:}$ For illustrative reasons the coordinate system here is rotated (real part upwards, imaginary part to the left), contrary to the usual representation by $90^\circ$. |
| − | [[File:P_ID712__Sig_T_4_2_S3.png| | + | [[File:P_ID712__Sig_T_4_2_S3.png|right|frame|Vector diagram of a harmonic oscillation]] |
| − | |||
On the basis of this diagram the following statements are possible: | On the basis of this diagram the following statements are possible: | ||
| − | *At the start time $t = 0$ the pointer of length $A$ ( | + | *At the start time $t = 0$ the pointer of length $A$ (amplitude) lies with angle $-\varphi$ in the complex plane. In the drawn example, $\varphi = 45^\circ$. |
| − | *For the times $t > 0$ the pointer rotates with constant angular velocity ( | + | *For the times $t > 0$ the pointer rotates with constant angular velocity (circular frequency) $\omega_{\rm T}$ in mathematically positive direction, i.e. counterclockwise. |
| − | *The top of the pointer thus always lies on a circle with radius $A$ and requires exactly the time $T_0$, i.e. the period of the harmonic oscillation $x(t)$ for one rotation. | + | *The top of the pointer thus always lies on a circle with radius $A$ and requires exactly the time $T_0$, i.e. the period duration of the harmonic oscillation $x(t)$ for one rotation. |
*The projection of the analytical signal $x_+(t)$ onto the real axis, marked by red dots, provides the instantaneous values of $x(t)$.}} | *The projection of the analytical signal $x_+(t)$ onto the real axis, marked by red dots, provides the instantaneous values of $x(t)$.}} | ||
| Line 146: | Line 149: | ||
<br> | <br> | ||
For further description we assume the following spectrum for the analytical signal: | For further description we assume the following spectrum for the analytical signal: | ||
| + | |||
| + | [[File:P_ID715__Sig_T_4_2_S4.png|right|frame|Vector diagram of a sum of three oscillations]] | ||
:$$X_+(f) = \sum_{i=1}^{I}A_i \cdot {\rm e}^{-{\rm j}\hspace{0.05cm}\cdot\hspace{0.05cm} | :$$X_+(f) = \sum_{i=1}^{I}A_i \cdot {\rm e}^{-{\rm j}\hspace{0.05cm}\cdot\hspace{0.05cm} | ||
\varphi_i}\cdot\delta (f - f_{i}) .$$ | \varphi_i}\cdot\delta (f - f_{i}) .$$ | ||
| − | The left | + | The left graphic shows such a spectrum for the example $I = 3$. If one chooses $I$ relatively large and the distance between adjacent spectral lines correspondingly small, then (frequency–) continuous spectral functions $X_+(f)$ can also be approximated with the above equation. |
| − | |||
| − | |||
| − | In the right | + | In the right graphic the corresponding time function is indicated. This is in general: |
:$$x_+(t) = \sum_{i=1}^{I}A_i \cdot {\rm e}^{ {\rm j}\hspace{0.05cm}\cdot\hspace{0.05cm}(\omega_i | :$$x_+(t) = \sum_{i=1}^{I}A_i \cdot {\rm e}^{ {\rm j}\hspace{0.05cm}\cdot\hspace{0.05cm}(\omega_i | ||
| Line 161: | Line 164: | ||
To note about this graphic: | To note about this graphic: | ||
*The sketch shows the initial position of the pointers at the start time $t = 0$ corresponding to the amplitudes $A_i$ and the phase positions $\varphi_i$. | *The sketch shows the initial position of the pointers at the start time $t = 0$ corresponding to the amplitudes $A_i$ and the phase positions $\varphi_i$. | ||
| − | *The tip of the resulting pointer compound is marked by the violet cross. One obtains by vectorial addition of the three individual pointers for the time $t = 0$: | + | *The tip of the resulting pointer compound is marked by the violet cross. One obtains by vectorial addition of the three individual pointers for the time $t = 0$: |
:$$x_+(t= 0) = \big [1 \cdot \cos(60^\circ) - 1 \cdot {\rm j} \cdot \sin(60^\circ) \big ]+ 2 \cdot \cos(0^\circ)+1 \cdot \cos(180^\circ) = 1.500 - {\rm j} \cdot 0.866.$$ | :$$x_+(t= 0) = \big [1 \cdot \cos(60^\circ) - 1 \cdot {\rm j} \cdot \sin(60^\circ) \big ]+ 2 \cdot \cos(0^\circ)+1 \cdot \cos(180^\circ) = 1.500 - {\rm j} \cdot 0.866.$$ | ||
*For times $t > 0$ the three pointers rotate at different angular speeds $\omega_i = 2\pi f_i$. The red hand rotates faster than the green hand, but slower than the blue hand. | *For times $t > 0$ the three pointers rotate at different angular speeds $\omega_i = 2\pi f_i$. The red hand rotates faster than the green hand, but slower than the blue hand. | ||
| − | *Since all hands rotate counterclockwise, the resulting hand $x_+(t)$ will also tend to move in this direction. At time $t = 1\,µ\text {s}$ the peak of the resulting pointer for the given parameter values is | + | *Since all hands rotate counterclockwise, the resulting hand $x_+(t)$ will also tend to move in this direction. At time $t = 1\,µ\text {s}$ the peak of the resulting pointer for the given parameter values is |
:$$ \begin{align*}x_+(t = 1 {\rm \hspace{0.05cm}µ s}) & = 1 \cdot {\rm e}^{-{\rm | :$$ \begin{align*}x_+(t = 1 {\rm \hspace{0.05cm}µ s}) & = 1 \cdot {\rm e}^{-{\rm | ||
Revision as of 15:00, 6 May 2021
Contents
Definition in the Frequency Domain
We consider a real band-pass signal $x(t)$ with the corresponding band-pass spectrum $X(f)$, which has an even real and an odd imaginary part with respect to the frequency zero point. It is assumed that the carrier frequency $f_{\rm T}$ is much larger than the bandwidth of the band-pass signal $x(t)$.
$\text{Definition:}$ The $\text{analytical signal}$ $x_+(t)$ belonging to the physical signal $x(t)$ is that time function, whose spectrum fulfills the following property:
- $$X_+(f)=\big[1+{\rm sign}(f)\big] \cdot X(f) = \left\{ {2 \cdot X(f) \; \hspace{0.2cm}\rm for\hspace{0.2cm} {\it f} > 0, \atop {\,\,\,\, \rm 0 \; \hspace{0.9cm}\rm for\hspace{0.2cm} {\it f} < 0.} }\right.$$
The $\text{sign function}$ is for positive $f$–values equal to $+1$ and for negative $f$-values equal to $-1$.
- The (double sided) limit value returns $\sign(0) = 0$.
- The index "+" should make clear that $X_+(f)$ has only parts at positive frequencies.
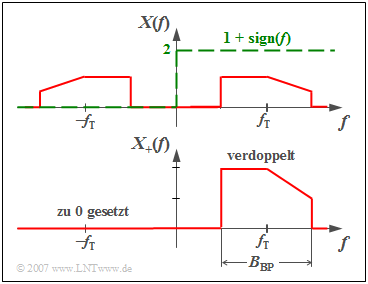
From the graphic you can see the calculation rule for $X_+(f)$:
The actual band-pass spectrum $X(f)$ will
- be doubled at the positive frequencies, and
- set to zero at the negative frequencies.
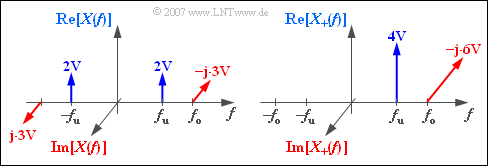
$\text{Example 1:}$
The graphic
- on the left shows the (discrete and complex) spectrum $X(f)$ of the "physical band-pass signal"
- $$x(t) = 4\hspace{0.05cm}{\rm V} \cdot {\cos} ( 2 \pi f_{\rm u} \hspace{0.03cm}t) + 6\hspace{0.05cm}{\rm V} \cdot {\sin} ( 2 \pi f_{\rm o} \hspace{0.03cm}t),$$
- on the right the (also discrete and complex) spectrum $X_{+}(f)$ of the corresponding "analytical signal" $x_{+}(t)$.
General calculation rule in the time domain
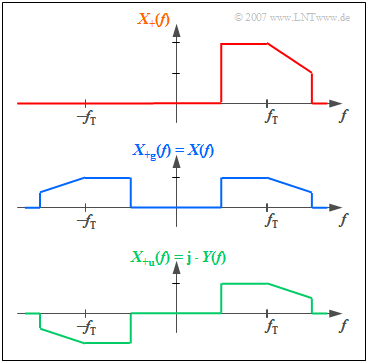
Now we will take a closer look at the spectrum $X_+(f)$ of the analytical signal and divide it with respect to $f = 0$ into
- an even (German: "gerade" ⇒ $\rm g$) part $X_{\rm +g}(f)$, and
- an odd (German: "ungerade" ⇒ $\rm u$) part $X_{\rm +u}(f)$:
- $$X_+(f) = X_{\rm +g}(f) + X_{\rm +u}(f).$$
All these spectra are generally complex.
If one considers the Assignment Theorem of the Fourier transform, then the following statements are possible on basis of the graphic:
- The even part $X_{\rm +g}(f)$ of $X_{+}(f)$ leads after the Fourier transform to a real time signal, and the odd part $X_{\rm +u}(f)$ to an imaginary one.
- It is obvious that $X_{\rm +g}(f)$ is equal to the physical Fourier spectrum $X(f)$ and thus the real part of $x_{\rm +g}(t)$ is equal to the given physical signal $x(t)$ with band-pass properties.
- If we denote the imaginary part with $y(t)$, the analytical signal is:
- $$x_+(t)= x(t) + {\rm j} \cdot y(t) .$$
- According to the generally valid laws of Fourier transform corresponding to the Assignment Theorem, the following applies to the spectral function of the imaginary part:
- $${\rm j} \cdot Y(f) = X_{\rm +u}(f)= {\rm sign}(f) \cdot X(f) \hspace{0.3cm}\Rightarrow\hspace{0.3cm}Y(f) = \frac{{\rm sign}(f)}{ {\rm j}}\cdot X(f).$$
- After transforming this equation into the time domain, the multiplication becomes the "convolution", and one gets:
- $$y(t) = \frac{1}{ {\rm \pi} t} \hspace{0.05cm}\star \hspace{0.05cm}x(t) = \frac{1}{ {\rm \pi}} \cdot \hspace{0.03cm}\int_{-\infty}^{+\infty}\frac{x(\tau)}{ {t - \tau}}\hspace{0.15cm} {\rm d}\tau.$$
Representation with Hilbert transform
At this point it is necessary to briefly discuss a further spectral transformation, which is dealt thoroughly in the book Linear and Time-invariant Systems .
$\text{Definition:}$ For the $\text{Hilbert transform}$ $ {\rm H}\left\{x(t)\right\}$ of a time function $x(t)$ applies:
- $$y(t) = {\rm H}\left\{x(t)\right\} = \frac{1}{ {\rm \pi} } \cdot \hspace{0.03cm}\int_{-\infty}^{+\infty}\frac{x(\tau)}{ {t - \tau} }\hspace{0.15cm} {\rm d}\tau.$$
- This particular integral cannot be solved in a simple, conventional way, but must be evaluated using the "Principal Value of Cauchy".
- Correspondingly valid in the frequency domain:
- $$Y(f) = - {\rm j} \cdot {\rm sign}(f) \cdot X(f) \hspace{0.05cm} .$$
The result of the last page can be summarized with this definition as follows:
- You get from the real, physical band-pass signal $x(t)$ the analytic signal $x_+(t)$ by adding to $x(t)$ an imaginary part according to the Hilbert transform:
- $$x_+(t) = x(t)+{\rm j} \cdot {\rm H}\left\{x(t)\right\} .$$
- The Hilbert transform $\text{H}\{x(t)\}$ disappears only in the case of $x(t) = \rm const.$ ⇒ DC signal. With all other signal forms the analytic signal $x_+(t)$ is always complex.
- From the analytical signal $x_+(t)$ the real band-pass signal can be easily determined by real part formation:
- $$x(t) = {\rm Re}\left\{x_+(t)\right\} .$$
$\text{Example 2:}$ The principle of the Hilbert transformation is illustrated here by the following diagram:
- According to the left representation $\rm (A)$, one gets the analytical signal $x_+(t)$ from the physical signal $x(t)$ by adding an imaginary part ${\rm j} \cdot y(t)$.
- Here $y(t) = {\rm H}\left\{x(t)\right\}$ is a real time function, which can be calculated easily in the spectral range by multiplying the spectrum $X(f)$ with $- {\rm j} \cdot \sign(f)$.
The right representation $\rm (B)$ is equivalent to $\rm (A)$:
- With the imaginary function $z(t)$ one obtains:
- $$x_+(t) = x(t) + z(t).$$
- A comparison of both models shows that it is indeed true:
- $$z(t) = {\rm j} \cdot y(t).$$
Vector diagram representation of the harmonic oscillation
The spectral function $X(f)$ of a harmonic oscillation $x(t) = A \cdot \text{cos}(2\pi f_{\rm T}t - \varphi)$ consists of two Dirac functions at the frequencies
- $+f_{\rm T}$ with the complex weight $A/2 \cdot \text{e}^{-\text{j}\hspace{0.05cm}\varphi}$,
- $-f_{\rm T}$ with the complex weight $A/2 \cdot \text{e}^{+\text{j}\hspace{0.05cm}\varphi}$.
Thus, the spectrum of the analytical signal is $($without the Dirac function at the frequency $f =-f_{\rm T})$:
- $$X_+(f) = A \cdot {\rm e}^{-{\rm j} \hspace{0.05cm}\varphi}\cdot\delta (f - f_{\rm T}) .$$
The corresponding time function is obtained by applying the Shifting Theorem:
- $$x_+(t) = A \cdot {\rm e}^{\hspace{0.05cm} {\rm j}\hspace{0.05cm}\cdot\hspace{0.05cm}( 2 \pi f_{\rm T} t \hspace{0.05cm}-\hspace{0.05cm} \varphi)}.$$
This equation describes a rotating pointer with constant angular velocity $\omega_{\rm T} = 2\pi f_{\rm T}$ .
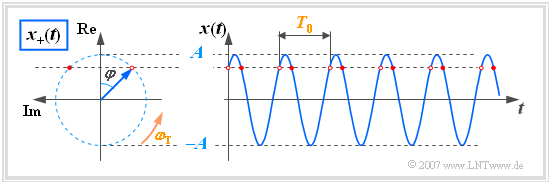
$\text{Example 3:}$ For illustrative reasons the coordinate system here is rotated (real part upwards, imaginary part to the left), contrary to the usual representation by $90^\circ$.
On the basis of this diagram the following statements are possible:
- At the start time $t = 0$ the pointer of length $A$ (amplitude) lies with angle $-\varphi$ in the complex plane. In the drawn example, $\varphi = 45^\circ$.
- For the times $t > 0$ the pointer rotates with constant angular velocity (circular frequency) $\omega_{\rm T}$ in mathematically positive direction, i.e. counterclockwise.
- The top of the pointer thus always lies on a circle with radius $A$ and requires exactly the time $T_0$, i.e. the period duration of the harmonic oscillation $x(t)$ for one rotation.
- The projection of the analytical signal $x_+(t)$ onto the real axis, marked by red dots, provides the instantaneous values of $x(t)$.
Vector diagram of a sum of harmonic oscillations
For further description we assume the following spectrum for the analytical signal:
- $$X_+(f) = \sum_{i=1}^{I}A_i \cdot {\rm e}^{-{\rm j}\hspace{0.05cm}\cdot\hspace{0.05cm} \varphi_i}\cdot\delta (f - f_{i}) .$$
The left graphic shows such a spectrum for the example $I = 3$. If one chooses $I$ relatively large and the distance between adjacent spectral lines correspondingly small, then (frequency–) continuous spectral functions $X_+(f)$ can also be approximated with the above equation.
In the right graphic the corresponding time function is indicated. This is in general:
- $$x_+(t) = \sum_{i=1}^{I}A_i \cdot {\rm e}^{ {\rm j}\hspace{0.05cm}\cdot\hspace{0.05cm}(\omega_i \hspace{0.05cm}\cdot\hspace{0.05cm} t \hspace{0.05cm}-\hspace{0.05cm} \varphi_i)}.$$
To note about this graphic:
- The sketch shows the initial position of the pointers at the start time $t = 0$ corresponding to the amplitudes $A_i$ and the phase positions $\varphi_i$.
- The tip of the resulting pointer compound is marked by the violet cross. One obtains by vectorial addition of the three individual pointers for the time $t = 0$:
- $$x_+(t= 0) = \big [1 \cdot \cos(60^\circ) - 1 \cdot {\rm j} \cdot \sin(60^\circ) \big ]+ 2 \cdot \cos(0^\circ)+1 \cdot \cos(180^\circ) = 1.500 - {\rm j} \cdot 0.866.$$
- For times $t > 0$ the three pointers rotate at different angular speeds $\omega_i = 2\pi f_i$. The red hand rotates faster than the green hand, but slower than the blue hand.
- Since all hands rotate counterclockwise, the resulting hand $x_+(t)$ will also tend to move in this direction. At time $t = 1\,µ\text {s}$ the peak of the resulting pointer for the given parameter values is
- $$ \begin{align*}x_+(t = 1 {\rm \hspace{0.05cm}µ s}) & = 1 \cdot {\rm e}^{-{\rm j}\hspace{0.05cm}\cdot \hspace{0.05cm}60^\circ}\cdot {\rm e}^{{\rm j}\hspace{0.05cm}2 \pi \hspace{0.05cm}\cdot \hspace{0.1cm}40 \hspace{0.05cm} \cdot \hspace{0.1cm} 0.001} + 2\cdot {\rm e}^{{\rm j}\hspace{0.05cm}2 \pi \hspace{0.05cm}\cdot \hspace{0.1cm}50 \hspace{0.05cm} \cdot \hspace{0.1cm} 0.001}- 1\cdot {\rm e}^{{\rm j}\hspace{0.05cm}2 \pi \hspace{0.05cm}\cdot \hspace{0.1cm}60 \hspace{0.05cm} \cdot \hspace{0.1cm} 0.001} = \\ & = 1 \cdot {\rm e}^{-{\rm j}\hspace{0.05cm}\cdot \hspace{0.05cm}45.6^\circ} + 2\cdot {\rm e}^{{\rm j}\hspace{0.05cm}\cdot \hspace{0.05cm}18^\circ}- 1\cdot {\rm e}^{{\rm j}\hspace{0.05cm}\cdot \hspace{0.05cm}21.6^\circ} \approx 1.673- {\rm j} \cdot 0.464.\end{align*}$$
- The resulting pointer tip does not lie on a circle like a single oscillation, but a complicated geometric figure is created.
The interactive applet Physical Signal & Analytical Signal illustrates $x_+(t)$ for the sum of three harmonic oscillations.
Exercises for the chapter
Exercise 4.3: Vector Diagram Representation
Exercise 4.3Z: Hilbert Transformator
Exercise 4.4: Vector Diagram for DSB-AM
Exercise 4.4Z: Vector Diagram for DSB-AM


