Difference between revisions of "Signal Representation/Direct Current Signal - Limit Case of a Periodic Signal"
| (26 intermediate revisions by 5 users not shown) | |||
| Line 1: | Line 1: | ||
{{Header | {{Header | ||
| − | |Untermenü= | + | |Untermenü=Periodic Signals |
| − | |Vorherige Seite= | + | |Vorherige Seite=General Description |
| − | |Nächste Seite= | + | |Nächste Seite=Harmonic Oscillation |
}} | }} | ||
| − | |||
| − | {{Definition} | + | ==Time signal representation== |
| − | + | <br> | |
| − | + | {{BlaueBox|TEXT= | |
| + | $\text{Definition:}$ | ||
| + | A »'''direct current (DC) signal«''' is a deterministic signal whose instantaneous values are constant for all times $t$ from $-\infty$ to $+\infty$. Such a signal is the borderline case of a [[ Signal_Representation/Harmonic_Oscillation|»harmonic oscillation«]], where the period duration $T_{0}$ has an infinitely large value.}} | ||
| − | == | + | [[File:Sig_T_2_2_S1a_Version2.png|right|frame|DC signal in time domain]] |
| + | According to this definition a DC signal always ranges from $t = -\infty$ to $t = +\infty$. | ||
| + | If the constant signal is only switched on at the time $t = 0$ there is no DC signal. | ||
| − | + | *A direct signal can never be a carrier of information in a communication system,  but transmitted signals can possess a »direct signal component«. | |
| − | + | ||
| − | + | *All statements made in the following for the direct current signal apply in the same way also to such a direct signal component. | |
| + | <br clear=all> | ||
| + | {{BlaueBox|TEXT= | ||
| + | $\text{Definition:}$ | ||
| + | For the »'''DC signal component'''« $A_{0}$ of any signal $x(t)$ applies: | ||
| + | |||
| + | :$$A_0 = \lim_{T_{\rm M}\to\infty}\,\frac{1}{T_{\rm M} }\cdot\int^{T_{\rm M}/2}_{-T_{\rm M}/2}x(t)\,{\rm d} t. $$ | ||
| − | + | *The measurement duration $T_{\rm M}$ should always be selected as large as possible $($infinite in borderline cases$)$. | |
| − | + | ||
| − | + | *The given equation is only valid if $T_{\rm M}$ lies symmetrical about the time $t=0$.}} | |
| + | {{GraueBox|TEXT= | ||
| + | [[File:P_ID298__Sig_T_2_2_S1_b_neu.png|right|frame|Random signal with DC componentl]] | ||
| + | $\text{Example 1:}$ | ||
| + | The graph shows a random signal $x(t)$. | ||
| + | *The DC component is here $A_{0} = 2\ \rm V$. | ||
| + | *In the sense of statistics, $A_{0}$ corresponds to the linear mean.}} | ||
| + | ==Spectral representation== | ||
| + | <br> | ||
| + | We now look at the situation in the frequency domain. From the time function it is already obvious, that it contains – spectrally speaking – only one single $($physical$)$ frequency, namely the frequency $f=0$. | ||
| − | + | ⇒ This result shall now be derived mathematically. | |
| + | In anticipation of the chapter [[Signal_Representation/Fourier_Transform_and_its_Inverse#The_first_Fourier_integral|»Fourier Transform«]] the connection between the time signal $x(t)$ and the corresponding spectrum $X(f)$ is already given here: | ||
| − | + | :$$X(f)= \hspace{0.05cm}\int_{-\infty} ^{{+}\infty} x(t) \, \cdot \, { \rm e}^{-\rm j 2\pi \it ft} \,{\rm d}t.$$ | |
| − | |||
| − | |||
| − | |||
| − | + | The spectral function $X(f)$ is called after the French mathematician | |
| − | + | [https://en.wikipedia.org/wiki/Joseph_Fourier $\text{Jean Baptiste Joseph Fourier}$] the »'''Fourier transform'''« of the signal $x(t)$ and the short labeling for this functional relation is | |
| + | :$$X(f)\ \bullet\!\!-\!\!\!-\!\!\circ\,\ x(t).$$ | ||
| − | + | For example, if $x(t)$ describes a voltage curve, so $X(f)$ has the unit "V/Hz". | |
| − | + | ⇒ Applying the Fourier transform to the DC signal $x(t)=A_{0}$ yields the spectral function | |
| − | + | ||
| − | + | :$$X(f)= A_0 \cdot \int_{-\infty} ^{+\hspace{0.01cm}\infty}\rm e \it ^{-\rm {j 2\pi} \it ft} \,{\rm d}t$$ | |
| − | |||
| − | {{ | ||
| + | with the following properties: | ||
| + | *The integral diverges for $f=0$, i.e. it returns an infinitely large value $($integration over the constant value $1)$. | ||
| − | + | *For a frequency $f\ne 0$, on the other hand, the integral is zero; the corresponding proof, however, is not trivial $($see next section$)$. | |
| − | |||
| − | |||
| − | |||
| − | + | {{BlaueBox|TEXT= | |
| − | + | $\text{Definition:}$ | |
| − | + | The searched spectral function $X(f)$ is compactly expressed by the following equation: | |
| − | $$X(f)\ | + | :$$X(f) = A_0 \, \cdot \, \rm \delta(\it f).$$ |
| − | + | # $\delta(f)$ is denoted as the »'''Dirac delta function'''«, also known as »'''distribution'''«. | |
| + | # $\delta(f)$ is a mathematically complicated function; the derivation can be found in the next section.}} | ||
| − | |||
| − | |||
| − | |||
| − | + | {{GraueBox|TEXT= | |
| − | + | [[File:Sig_T_2_2_S2_Version2.png|right|frame|DC signal and its spectral function]] | |
| − | * | + | $\text{Example 2:}$ |
| − | + | The graphic shows the functional connection | |
| + | *between an DC signal $x(t)=A_{0}$ and | ||
| − | + | *its corresponding spectral function $X(f)=A_{0} \cdot \delta(f)$. | |
| − | |||
| − | |||
| − | + | The Dirac delta function at frequency $f=0$ is represented by an arrow with weight $A_{0}$. }} | |
| − | |||
| − | |||
| − | + | ==Dirac (delta) function in frequency domain== | |
| + | <br> | ||
| + | {{BlaueBox|TEXT= | ||
| + | $\text{Definition:}$ | ||
| + | The »'''Dirac delta function'''« ⇒ short: »'''Dirac function'''« has the following properties: | ||
| + | *The Dirac delta function is infinitely narrow, i.e. it is $\delta(f)=0$ for $f \neq 0$. | ||
| + | *The Dirac delta function $\delta(f)$ is infinitely high at the frequency $f = 0$ . | ||
| − | == | + | *The Dirac delta weight $($area of the Dirac function$)$ yields a finite value, namely $1$: |
| + | :$$\int_\limits{-\infty} ^{+\infty} \delta( f)\,{\rm d}f =1.$$ | ||
| + | *It follows from this last property that $\delta(f)$ has the unit ${\rm Hz}^{-1} = {\rm s}$ .}} | ||
| − | {{ | + | {{BlaueBox|TEXT= |
| + | [[File:P_ID519__Sig_T_2_2_S3_rah.png|right|frame|The derivation of the Dirac delta function]] | ||
| + | $\text{Proof:}$ | ||
| + | For the mathematical derivation of these properties we assume a dimensionless DC signal $x(t)$. | ||
| − | + | *To force the convergence of the Fourier integral, the non-energy-limited signal $x(t)$ is multiplied by a bilateral declining exponential function. | |
| − | * | ||
| − | |||
| − | |||
| − | |||
| − | + | *The graph shows the signal $x(t)=1$ and the energy-limited signal | |
| − | |||
| + | :$$x_{\varepsilon} (t) = \rm e^{\it -\varepsilon \hspace{0.05cm} \cdot \hspace{0.05cm} \vert \hspace{0.01cm} t \hspace{0.01cm}\vert}{.}$$ | ||
| − | + | :It applies $\varepsilon > 0$. At the limit $\varepsilon \to 0$ , $x_{\varepsilon}(t)$ passes to $x(t)=1$. | |
| − | $$ | + | *The spectral representation is obtained by applying the Fourier integral given above: |
| − | + | ||
| − | + | :$$X_\varepsilon (f)=\int_{-\infty}^{0} {\rm e}^{\varepsilon{t} }\, {\cdot}\, {\rm e}^{-\rm j 2\pi \it ft} \,{\rm d}t \hspace{0.2cm}+ \hspace{0.2cm} \int_{0}^{+\infty} {\rm e}^{-\varepsilon t} \,{\cdot}\, { \rm e}^{-\rm j 2\pi \it ft} \,{\rm d}t.$$ | |
| − | + | *After integration and combination of both parts we obtain the purely real spectral function of the energy-limited signal $x_{\varepsilon}(t)$: | |
| − | |||
| − | |||
| − | $$X_\varepsilon (f)=\ | + | :$$X_\varepsilon (f)=\frac{1}{\varepsilon -\rm j \cdot 2\pi \it f} + \frac{1}{\varepsilon+\rm j \cdot 2\pi \it f} = \frac{2\varepsilon}{\varepsilon^2 + (\rm 2\pi {\it f}\hspace{0.05cm} ) \rm ^2} \, .$$ |
| − | + | *The area under the $X_\varepsilon (f)$ curve is independent of the parameter $\varepsilon$ equals $1$. The smaller $ε$ is selected, the narrower and higher the function becomes, as the $($German language$)$ learning video [[Herleitung und Visualisierung der Diracfunktion (Lernvideo)|»Herleitung und Visualisierung der Diracfunktion«]] ⇒ "Derivation and visualization of the Dirac delta function" shows. | |
| − | |||
| − | $ | ||
| − | + | *The limit for $\varepsilon \to 0$ returns the Dirac delta function with weight $1$: | |
| − | $$\lim_{\varepsilon \hspace{0.05cm} \to \hspace{0.05cm} 0}X_\varepsilon (f)= \delta(f).$$ | + | :$$\lim_{\varepsilon \hspace{0.05cm} \to \hspace{0.05cm} 0}X_\varepsilon (f)= \delta(f).$$}} |
| − | |||
| − | |||
| − | |||
| − | |||
| − | [[Aufgaben: | + | ==Exercises for the chapter== |
| + | <br> | ||
| + | [[Aufgaben:Exercise_2.2:_Direct_Current_Component_of_Signals|Exercise 2.2: Direct Current Component of Signals]] | ||
| − | [[Aufgaben: | + | [[Aufgaben:Exercise_2.2Z:_Nonlinearities|Exercise 2.2Z: Non–Linearities]] |
{{Display}} | {{Display}} | ||
Latest revision as of 16:55, 8 June 2023
Contents
Time signal representation
$\text{Definition:}$ A »direct current (DC) signal« is a deterministic signal whose instantaneous values are constant for all times $t$ from $-\infty$ to $+\infty$. Such a signal is the borderline case of a »harmonic oscillation«, where the period duration $T_{0}$ has an infinitely large value.
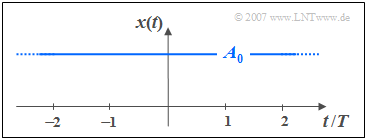
According to this definition a DC signal always ranges from $t = -\infty$ to $t = +\infty$. If the constant signal is only switched on at the time $t = 0$ there is no DC signal.
- A direct signal can never be a carrier of information in a communication system,  but transmitted signals can possess a »direct signal component«.
- All statements made in the following for the direct current signal apply in the same way also to such a direct signal component.
$\text{Definition:}$ For the »DC signal component« $A_{0}$ of any signal $x(t)$ applies:
- $$A_0 = \lim_{T_{\rm M}\to\infty}\,\frac{1}{T_{\rm M} }\cdot\int^{T_{\rm M}/2}_{-T_{\rm M}/2}x(t)\,{\rm d} t. $$
- The measurement duration $T_{\rm M}$ should always be selected as large as possible $($infinite in borderline cases$)$.
- The given equation is only valid if $T_{\rm M}$ lies symmetrical about the time $t=0$.
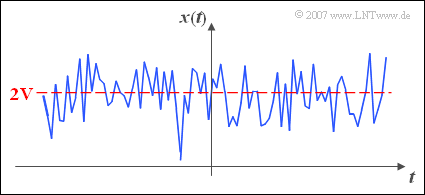
$\text{Example 1:}$ The graph shows a random signal $x(t)$.
- The DC component is here $A_{0} = 2\ \rm V$.
- In the sense of statistics, $A_{0}$ corresponds to the linear mean.
Spectral representation
We now look at the situation in the frequency domain. From the time function it is already obvious, that it contains – spectrally speaking – only one single $($physical$)$ frequency, namely the frequency $f=0$.
⇒ This result shall now be derived mathematically. In anticipation of the chapter »Fourier Transform« the connection between the time signal $x(t)$ and the corresponding spectrum $X(f)$ is already given here:
- $$X(f)= \hspace{0.05cm}\int_{-\infty} ^{{+}\infty} x(t) \, \cdot \, { \rm e}^{-\rm j 2\pi \it ft} \,{\rm d}t.$$
The spectral function $X(f)$ is called after the French mathematician $\text{Jean Baptiste Joseph Fourier}$ the »Fourier transform« of the signal $x(t)$ and the short labeling for this functional relation is
- $$X(f)\ \bullet\!\!-\!\!\!-\!\!\circ\,\ x(t).$$
For example, if $x(t)$ describes a voltage curve, so $X(f)$ has the unit "V/Hz".
⇒ Applying the Fourier transform to the DC signal $x(t)=A_{0}$ yields the spectral function
- $$X(f)= A_0 \cdot \int_{-\infty} ^{+\hspace{0.01cm}\infty}\rm e \it ^{-\rm {j 2\pi} \it ft} \,{\rm d}t$$
with the following properties:
- The integral diverges for $f=0$, i.e. it returns an infinitely large value $($integration over the constant value $1)$.
- For a frequency $f\ne 0$, on the other hand, the integral is zero; the corresponding proof, however, is not trivial $($see next section$)$.
$\text{Definition:}$ The searched spectral function $X(f)$ is compactly expressed by the following equation:
- $$X(f) = A_0 \, \cdot \, \rm \delta(\it f).$$
- $\delta(f)$ is denoted as the »Dirac delta function«, also known as »distribution«.
- $\delta(f)$ is a mathematically complicated function; the derivation can be found in the next section.
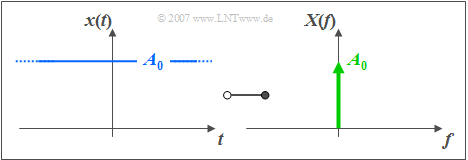
$\text{Example 2:}$ The graphic shows the functional connection
- between an DC signal $x(t)=A_{0}$ and
- its corresponding spectral function $X(f)=A_{0} \cdot \delta(f)$.
The Dirac delta function at frequency $f=0$ is represented by an arrow with weight $A_{0}$.
Dirac (delta) function in frequency domain
$\text{Definition:}$ The »Dirac delta function« ⇒ short: »Dirac function« has the following properties:
- The Dirac delta function is infinitely narrow, i.e. it is $\delta(f)=0$ for $f \neq 0$.
- The Dirac delta function $\delta(f)$ is infinitely high at the frequency $f = 0$ .
- The Dirac delta weight $($area of the Dirac function$)$ yields a finite value, namely $1$:
- $$\int_\limits{-\infty} ^{+\infty} \delta( f)\,{\rm d}f =1.$$
- It follows from this last property that $\delta(f)$ has the unit ${\rm Hz}^{-1} = {\rm s}$ .
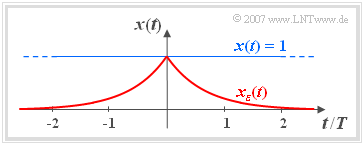
$\text{Proof:}$ For the mathematical derivation of these properties we assume a dimensionless DC signal $x(t)$.
- To force the convergence of the Fourier integral, the non-energy-limited signal $x(t)$ is multiplied by a bilateral declining exponential function.
- The graph shows the signal $x(t)=1$ and the energy-limited signal
- $$x_{\varepsilon} (t) = \rm e^{\it -\varepsilon \hspace{0.05cm} \cdot \hspace{0.05cm} \vert \hspace{0.01cm} t \hspace{0.01cm}\vert}{.}$$
- It applies $\varepsilon > 0$. At the limit $\varepsilon \to 0$ , $x_{\varepsilon}(t)$ passes to $x(t)=1$.
- The spectral representation is obtained by applying the Fourier integral given above:
- $$X_\varepsilon (f)=\int_{-\infty}^{0} {\rm e}^{\varepsilon{t} }\, {\cdot}\, {\rm e}^{-\rm j 2\pi \it ft} \,{\rm d}t \hspace{0.2cm}+ \hspace{0.2cm} \int_{0}^{+\infty} {\rm e}^{-\varepsilon t} \,{\cdot}\, { \rm e}^{-\rm j 2\pi \it ft} \,{\rm d}t.$$
- After integration and combination of both parts we obtain the purely real spectral function of the energy-limited signal $x_{\varepsilon}(t)$:
- $$X_\varepsilon (f)=\frac{1}{\varepsilon -\rm j \cdot 2\pi \it f} + \frac{1}{\varepsilon+\rm j \cdot 2\pi \it f} = \frac{2\varepsilon}{\varepsilon^2 + (\rm 2\pi {\it f}\hspace{0.05cm} ) \rm ^2} \, .$$
- The area under the $X_\varepsilon (f)$ curve is independent of the parameter $\varepsilon$ equals $1$. The smaller $ε$ is selected, the narrower and higher the function becomes, as the $($German language$)$ learning video »Herleitung und Visualisierung der Diracfunktion« ⇒ "Derivation and visualization of the Dirac delta function" shows.
- The limit for $\varepsilon \to 0$ returns the Dirac delta function with weight $1$:
- $$\lim_{\varepsilon \hspace{0.05cm} \to \hspace{0.05cm} 0}X_\varepsilon (f)= \delta(f).$$
Exercises for the chapter
Exercise 2.2: Direct Current Component of Signals
Exercise 2.2Z: Non–Linearities


