Difference between revisions of "Signal Representation/The Fourier Transform and its Inverse"
| Line 116: | Line 116: | ||
*To emphasize this fact, we denote the frequency–running variable of function ${X_{\rm P}}'(f)$ with $\nu$ instead of $n$. The following applies: $\nu=k \cdot n$. | *To emphasize this fact, we denote the frequency–running variable of function ${X_{\rm P}}'(f)$ with $\nu$ instead of $n$. The following applies: $\nu=k \cdot n$. | ||
*For the spectral line of the signal ${x_{\rm P}}'(t)$ at the frequency $f=n \cdot f_0 =\nu \cdot {f_0}'$ applies: | *For the spectral line of the signal ${x_{\rm P}}'(t)$ at the frequency $f=n \cdot f_0 =\nu \cdot {f_0}'$ applies: | ||
| − | $${D_\nu}' = {1}/{k} \cdot D_n, \hspace{0.5cm} {\rm where} \hspace{0.5cm} \nu = k \cdot n.$ | + | $${D_\nu}' = {1}/{k} \cdot D_n, \hspace{0.5cm} {\rm where} \hspace{0.5cm} \nu = k \cdot n.$$ |
| Line 179: | Line 179: | ||
| − | + | Let us still consider the units of the two functions in the time and frequency domain: | |
| − | * | + | *If $x(t)$ is, for example, a voltage, so the pulse amplitude $A$ has the unit "Volt". |
| − | * | + | *The dimension of the quantity $T$ is often time, for example with the unit "second". |
| − | * | + | *The reciprocal value of time is the frequency with the unit "Hertz". |
| − | * | + | *The argument $f \cdot T$ is dimensionless. |
| − | * | + | *The spectral function $X(f)$ thus has the unit "V/Hz", for example. |
==Fourier Transform== | ==Fourier Transform== | ||
<br> | <br> | ||
| − | + | The spectrum $X(f)$ of a signal $x(t)$ is according to the "first fourier integral": | |
:$$X(f)= \hspace{0.05cm}\int _{-\infty} ^{{+}\infty} x(t) \, \cdot \, { \rm e}^{-\rm j 2\pi \it ft} \,{\rm d}t.$$ | :$$X(f)= \hspace{0.05cm}\int _{-\infty} ^{{+}\infty} x(t) \, \cdot \, { \rm e}^{-\rm j 2\pi \it ft} \,{\rm d}t.$$ | ||
| − | + | As shown on the last page with a simple example, this integral can be solved easily for an energy-limited signal $x(t)$ . For non-energy limited signals, for example | |
| − | * | + | *a [[Signal_Representation/Direct_Current_Signal_-_Limit_Case_of_a_Periodic_Signal|Direct Current Signal]] , |
| − | * | + | *a [[ Signal_Representation/Harmonic_Oscillation|harmonic oscillation]], or |
| − | * | + | *a echoing signal. |
| − | + | we observe a divergence of the Fourier integral. Including a bilateral declining auxiliary function $\varepsilon (t)$ however, convergence can be forced: | |
:$$X(f) = \lim_{\varepsilon \to 0} \int _{-\infty} ^{{+}\infty} x(t) \cdot {\rm e}^{\it -\varepsilon | \hspace{0.01cm} t \hspace{0.01cm} |} \cdot {\rm e}^{{-\rm j 2 \pi}\it ft} \,{\rm d}t.$$ | :$$X(f) = \lim_{\varepsilon \to 0} \int _{-\infty} ^{{+}\infty} x(t) \cdot {\rm e}^{\it -\varepsilon | \hspace{0.01cm} t \hspace{0.01cm} |} \cdot {\rm e}^{{-\rm j 2 \pi}\it ft} \,{\rm d}t.$$ | ||
| − | + | Such non-energy limited signals lead to so-called „Dirac functions”in the spectral domain, sometimes also called "distributions". | |
{{BlaueBox|TEXT= | {{BlaueBox|TEXT= | ||
$\text{Definition:}$ | $\text{Definition:}$ | ||
| − | + | The generally valid functional relation $X(f) = F\big [x(t) \big ]$ is called '''Fourier Transform''. For the short notation we use (with the „white” dot for the time domain and the filled dot for the spectral domain): | |
:$$X(f)\ \bullet\!\!-\!\!\!-\!\!\!-\!\!\circ\,\ x(t).$$ | :$$X(f)\ \bullet\!\!-\!\!\!-\!\!\!-\!\!\circ\,\ x(t).$$ | ||
| − | + | With a ringing signal, however, convergence is only achieved as long as the time function increases less than exponentially }} | |
| − | [[File:P_ID655__Sig_T_3_1_S6.png|right|frame| | + | [[File:P_ID655__Sig_T_3_1_S6.png|right|frame| Jump Function and Associated Spectrum]] |
{{GraueBox|TEXT= | {{GraueBox|TEXT= | ||
| − | $\text{ | + | $\text{Example 3:}$ |
| − | + | We consider an acausal jump function | |
:$$x (t) = \left\{ {\begin{array}{*{20}c} { +1 } & { {\rm{f\ddot{u}r} }\quad t > 0,} \\ {-1 } & { {\rm{f\ddot{u}r} }\quad t < 0.} \\\end{array} } \right.$$ | :$$x (t) = \left\{ {\begin{array}{*{20}c} { +1 } & { {\rm{f\ddot{u}r} }\quad t > 0,} \\ {-1 } & { {\rm{f\ddot{u}r} }\quad t < 0.} \\\end{array} } \right.$$ | ||
| − | + | This signal is shown in blue color in the left sketch. | |
| − | + | Since the signal $x(t)$ extends to infinity on both sides,we must add a suitable convergence factor $\text{e}^{-\varepsilon \hspace{0.05cm} \cdot \hspace{0.05cm}\vert \hspace{0.05cm} t \hspace{0.05cm} \vert}$ $($ $\varepsilon > 0 is valid)$ in order to calculate the Fourier transform for both sections . The resulting time function is then | |
:$$x_\varepsilon (t) = \left\{ {\begin{array}{*{20}c} { {\rm{e} }^{ - \varepsilon \hspace{0.05cm} \cdot \hspace{0.05cm}t} } & { {\rm{f\ddot{u}r} }\quad t > 0,} \\ { {\rm{ - e} }^{\hspace{0.05cm}\varepsilon\hspace{0.05cm} \cdot \hspace{0.05cm} t} } & { {\rm{f\ddot{u}r} }\quad t < 0.} \\\end{array} } \right.$$ | :$$x_\varepsilon (t) = \left\{ {\begin{array}{*{20}c} { {\rm{e} }^{ - \varepsilon \hspace{0.05cm} \cdot \hspace{0.05cm}t} } & { {\rm{f\ddot{u}r} }\quad t > 0,} \\ { {\rm{ - e} }^{\hspace{0.05cm}\varepsilon\hspace{0.05cm} \cdot \hspace{0.05cm} t} } & { {\rm{f\ddot{u}r} }\quad t < 0.} \\\end{array} } \right.$$ | ||
| − | + | Following a similar procedure as on the page [[Signal_Representation/Direct_Current_Signal_-_Limit_Case_of_a_Periodic_Signal#Diracfunktion_im_Frequenzbereich|Dirac Function in the Frequency Domain]] results for the corresponding spectral function: | |
:$$X_\varepsilon (f) = \frac{1}{ {\varepsilon + {\rm{j} }2{\rm{\pi } }f} } - \frac{1}{ {\varepsilon - {\rm{j} }2{\rm{\pi } }f} } = \frac{ { - {\rm{j4\pi } }f} }{ {\varepsilon ^2 + \left( {2{\rm{\pi } }f} \right)^2 } }.$$ | :$$X_\varepsilon (f) = \frac{1}{ {\varepsilon + {\rm{j} }2{\rm{\pi } }f} } - \frac{1}{ {\varepsilon - {\rm{j} }2{\rm{\pi } }f} } = \frac{ { - {\rm{j4\pi } }f} }{ {\varepsilon ^2 + \left( {2{\rm{\pi } }f} \right)^2 } }.$$ | ||
| − | + | But actually we are interested in the spectrum of the actual jump function | |
:$$x(t) = \mathop {\lim }\limits_{\varepsilon \hspace{0.05cm}\to \hspace{0.05cm}0 } x_\varepsilon (t).$$ | :$$x(t) = \mathop {\lim }\limits_{\varepsilon \hspace{0.05cm}\to \hspace{0.05cm}0 } x_\varepsilon (t).$$ | ||
| − | + | Therefore, the spectral function $X(f) =\text{F}\big[x(t)\big]$ has to be determined as limit value of $X_\varepsilon(f)$ for $\varepsilon \to 0$ : | |
:$$X(f) = \mathop {\lim }\limits_{\varepsilon \hspace{0.05cm} \to \hspace{0.05cm}0 } X_\varepsilon (f) = \frac{ { - {\rm{j} } } }{ { {\rm{\pi } }f} } = \frac{1}{ { {\rm{j\pi } }f} }.$$ | :$$X(f) = \mathop {\lim }\limits_{\varepsilon \hspace{0.05cm} \to \hspace{0.05cm}0 } X_\varepsilon (f) = \frac{ { - {\rm{j} } } }{ { {\rm{\pi } }f} } = \frac{1}{ { {\rm{j\pi } }f} }.$$ | ||
| − | In | + | In the right graph the imaginary spectral function $X(f)$ is shown as a blue curve. You can see that $\vert X(f) \vert$ decreases continuously with increasing frequency. |
| − | + | The green curve in the left graph shows the signal $y(t)$, which differs from $x(t)$ only in the negative time section. | |
| − | *In | + | *In this area $y(t) = 0$. The corresponding spectral function $Y(f)$ is only half as large as $X(f)$ in the entire range. This is shown in the following calculation: |
:$$Y(f) = \mathop {\lim }\limits_{\varepsilon \to 0 } Y_\varepsilon (f) = \mathop {\lim }\limits_{\varepsilon \hspace{0.05cm} \to \hspace{0.05cm}0 }\frac{1}{ {\varepsilon + {\rm{j} }2{\rm{\pi } }f} } = \frac{1}{ { {\rm{j2\pi } }f} }.$$ | :$$Y(f) = \mathop {\lim }\limits_{\varepsilon \to 0 } Y_\varepsilon (f) = \mathop {\lim }\limits_{\varepsilon \hspace{0.05cm} \to \hspace{0.05cm}0 }\frac{1}{ {\varepsilon + {\rm{j} }2{\rm{\pi } }f} } = \frac{1}{ { {\rm{j2\pi } }f} }.$$ | ||
| − | * | + | *In addition to that there is now a Dirac function at $f = 0$ with the weight $1/2$, due to the equal part,. This is explained in detail in the example in section [[Signal_Representation/Fourier_Transform_Laws#Zuordnungssatz|Mapping theorem]] }} |
| − | == | + | ==The Second Fourier Integral== |
<br> | <br> | ||
| − | + | Up to now, it has only been shown how to calculate the corresponding spectral function $x(t)$ $X(f)$ for an aperiodic, pulse-shaped signal $x(t)$ . Now we turn to the reverse task, namely: How to determine the time function $x(t)$ from the spectral function $X(f)$? | |
| − | [[File:P_ID399__Sig_T_3_1_S7_rah.png|center|frame| | + | [[File:P_ID399__Sig_T_3_1_S7_rah.png|center|frame|On the Second Fourier Integral]] |
| − | + | With the same designations as on the first pages of this chapter, you can write the signal $x(t)$ as a Fourier series, where now the boundary ${f_0}' \to 0$ is to be considered: | |
:$$x(t)=\lim_{{f_{\rm 0}}' \hspace{0.05cm}\to \hspace{0.05cm}0} \sum^{+\infty}_{\nu = -\infty}{D_{\it \nu}}' \cdot \rm e^{j\hspace{0.03cm} 2 \hspace{0.03cm}\pi \hspace{0.03cm}\it\nu \hspace{0.03cm} {f_{\rm 0}}' t}.$$ | :$$x(t)=\lim_{{f_{\rm 0}}' \hspace{0.05cm}\to \hspace{0.05cm}0} \sum^{+\infty}_{\nu = -\infty}{D_{\it \nu}}' \cdot \rm e^{j\hspace{0.03cm} 2 \hspace{0.03cm}\pi \hspace{0.03cm}\it\nu \hspace{0.03cm} {f_{\rm 0}}' t}.$$ | ||
| − | + | If you now extend both the numerator and the denominator by ${f_0}'$, you get | |
:$$x(t)=\lim_{{f_{\rm 0}}' \hspace{0.05cm}\to \hspace{0.05cm}0} \sum^{+\infty}_{\nu = -\infty} ({{D_{\it \nu}}'}/{{f_{\rm 0}}'}) \cdot \rm e^{j \hspace{0.03cm}2\hspace{0.03cm} \pi \hspace{0.03cm} \it \nu \hspace{0.03cm}{f_{\rm 0}}' t} \cdot {\it f_{\rm 0}}'.$$ | :$$x(t)=\lim_{{f_{\rm 0}}' \hspace{0.05cm}\to \hspace{0.05cm}0} \sum^{+\infty}_{\nu = -\infty} ({{D_{\it \nu}}'}/{{f_{\rm 0}}'}) \cdot \rm e^{j \hspace{0.03cm}2\hspace{0.03cm} \pi \hspace{0.03cm} \it \nu \hspace{0.03cm}{f_{\rm 0}}' t} \cdot {\it f_{\rm 0}}'.$$ | ||
| − | + | The limit crossing ${f_0}'. \to 0$ has the following effects: | |
| − | * | + | *The (infinite) sum becomes an integral, where ${f_0}'$ has to be formally replaced by the differential quantity $\text{d}f$ (integration variable). |
| − | * | + | *The quantity $\nu \cdot{f_0}'$ in the exponent describes the physical frequency $f$. |
| − | * | + | *The quotient ${D_{\nu}}'/{f_0}'$ yields the spectral function $X(f)$ at the frequency $f$. |
| − | + | Taking these properties into account, the „second Fourier integral” is obtained. | |
{{BlaueBox|TEXT= | {{BlaueBox|TEXT= | ||
| − | $\text{ | + | $\text{Second Fourier Integral:}$ |
| − | + | If the spectral function $X(f)$ of an aperiodic and energy-limited signal is given, then the corresponding '''time function''' is: | |
:$$x(t) = \hspace{0.01cm}\int_{-\infty} ^{ {+}\infty} X(f) \, \cdot \, { \rm e}^{\rm j 2\pi \it ft} \,{\rm d}f.$$}} | :$$x(t) = \hspace{0.01cm}\int_{-\infty} ^{ {+}\infty} X(f) \, \cdot \, { \rm e}^{\rm j 2\pi \it ft} \,{\rm d}f.$$}} | ||
| Line 278: | Line 278: | ||
| − | == | + | ==Exercises for the Chapter== |
<br> | <br> | ||
[[Aufgaben:3.1 Spektrum des Exponentialimpulses|Aufgabe 3.1: Spektrum des Exponentialimpulses]] | [[Aufgaben:3.1 Spektrum des Exponentialimpulses|Aufgabe 3.1: Spektrum des Exponentialimpulses]] | ||
Revision as of 23:20, 31 October 2020
Contents
# OVERVIEW OF THE THIRD MAIN CHAPTER #
In the second chapter periodic signals were described by different harmonic oscillations („fourier series”). If one reduces – at least mentally – the pulse repetition frequency of a periodic signal more and more, i.e., the period duration becomes longer and longer, then one comes from the periodic signal (pulse) to the unique aperiodic signal – often also called pulse .
In the following, such aperiodic, impulse-shaped signals are considered and mathematically described in the time– and frequency domain.
The chapter contains in detail:
- the derivation of the two fourier integral from the fourier series
- the extension of the Fourier integral to fourier transform by means of distributions,
- some special cases impulse-like signals like square–, Gauss– and Diracimpulse,
- the laws of the fourier transform, and finally
- the meaning of the convolution operation and its various applications.
The Laplace– and the Hilbert transform, which are only applicable to causal signals or systems, will be treated in the next book „Linear time-invariant systems”.
Further information on the topic as well as tasks, simulations and programming exercises can be found in the
- Chapter 6: Linear time-invariant systems, Program lzi
of the lab „Simulation Methods in Communication Engineering”. This (former) LNT course at the TU Munich is based on
- the educational software package LNTsim ⇒ Link points to the ZIP version of the program and
- the associated lab description ⇒ Link refers to the PDF version; Chapter 6: pages 99-118.
Properties of aperiodic signals
In the last chapter periodic signals were considered. The essential characteristic of these signals is, that you can specify a period duration $T_0$ for them. If such a period duration cannot be indicated or - which is the same in practice - has $T_0$ an infinitely large value, one speaks of an 'aperiodic signal.
For the present chapter „Aperiodic Signals – Impulse” the following conditions should apply:
- The considered signals $x(t)$ are aperiodic and energy-limited: They possess a finite energy $E_x$ and a negligible (medium) power $P_x$.
- Often the energy of these signals is concentrated on a relatively short time range, so that one also speaks of impulse-shaped signals .
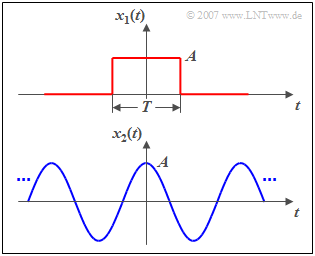
$\text{Example 1:}$ The figure above shows a rectangular pulse $x_1(t)$ with amplitude $A$ and duration $T$ as an example of an aperiodic and time-limited signal. This pulse has
- the finite signal-energy ⇒ here: $E_1=A^2 \cdot T$, and
- the power $P_1$ = 0.
A power-limited signal, for example the cosine signal $x_2(t)$, shown below, has
- always a finite power ⇒ here: $P_2=A^2/2$, and
- thus also an infinitely large signal energy: $E_2 \to \infty$.
Closer Examination of the Fourier Coefficients
We assume a periodic signal $x_{\rm P}(t)$ with the period duration $T_0$ which corresponds to the explanations on the page Complex Fourier Series . This signal can be displayed as follows:
- $$x_{\rm P}(t)=\sum^{+\infty}_{n=-\infty}D_{\it n}\cdot \rm e^{j 2 \pi \hspace{0.01cm}{\it n} \hspace{0.01cm}\it t / T_{\rm 0}}.$$
- The Fourier coefficients are generally complex
$($it applies $D_{-n}={D_n}^\ast)$:
- $$D_n=\frac{1}{T_0}\cdot \int^{+T_0/2}_{-T_0/2}x_{\rm P}(t) \cdot{\rm e}^{-\rm j 2 \pi \hspace{0.01cm}{\it n} \it t / T_{\rm 0}}\, {\rm d}t.$$
- The corresponding spectral function $X_{\rm P}(f)$ is a so-called line spectrum with spectral lines in the distance $f_0=1/T_0$:
- $$X_{\rm P}(f)=\sum^{+\infty}_{n=-\infty}D_n\cdot\delta(f-n\cdot f_0).$$
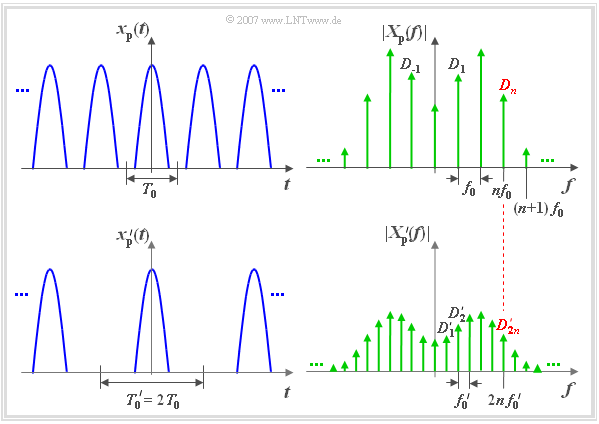
The upper figure shows on the left the periodic time signal $x_{\rm P}(t)$ and on the right the corresponding magnitude spectrum $|X_{\rm P}(f)|$. This is merely a schematic sketch:
Further notes:
- If $x_{\rm P}(t)$ is a real and even function, then $X_{\rm P}(f)$ is also real and even.
- The equation $X_{\rm P}(f) = |X_{\rm P}(f)|$ is only valid if all spectral lines are positive.
In the lower figure on the left side another periodic signal ${x_{\rm P}}\hspace{0.01cm}'(t)$ with double period duration ${T_0}\hspace{0.01cm}' = 2 \cdot T_0$ is displayed. The following applies to this signal:
- $${x_{\rm P}}'(t)=\sum^{+\infty}_{n=-\infty}{\it D_n}'\cdot {\rm e}^{{\rm j} 2 \pi \hspace{-0.05cm}{\it n t / T}_{\rm 0}\hspace{0.01cm}'} \hspace{0.3cm}{\rm mit}\hspace{0.3cm}{\it D_n}'=\frac{1}{{T_0}\hspace{0.01cm}'}\cdot \int^{{+T_0}'/2}_{-{T_0}'/2}{x_{\rm P}}'(t) \cdot{\rm e}^{-\rm j 2 \pi \hspace{-0.05cm}{\it n t / T}_{\rm 0}\hspace{0.01cm}'}\, {\rm d}\it t.$$
In the range from $-T_0/2$ to $+T_0/2$ the two signals are identical. We will also consider the spectral function ${X_{\rm P} }'(f)$ according to the right sketch:
- Due to the double period duration $({T_0}' = 2 \cdot T_0)$ the spectral lines are now closer together $({f_0}' = f_0/2)$.
- Both red marked coefficients $D_n$ und ${D_{2n}}'$ belong to the same physical frequency $f = n \cdot f_0 = 2n \cdot {f_0}'$.
We recognize by a comparison of the two coefficients
- $$D_n=\frac{1}{T_0}\cdot \int^{+T_0/2}_{-T_0/2}x_{\rm P}(t) \cdot{\rm e}^{-\rm j 2 \pi \hspace{-0.05cm}{\it n} \it t / T_{\rm 0}}\, {\rm d}t \hspace{0.5cm}\text{und} \hspace{0.5cm} {D_{2n}}'=\frac{1}{{T_0}'}\cdot \int^{+{T_0}'/2}_{-{T_0}'/2}{x_{\rm P}}'(t) \cdot{\rm e}^{-\rm j 4 \pi \hspace{-0.05cm}{\it n} \it t / {T_{\rm 0}}'}\, {\rm d}t \text{:} $$
- ${x_{\rm P}}'(t) \equiv 0$ betweeen $T_0/2$ and ${T_0}'/2$ ist also in a symmetrical interval for negative times.
- Therefore the integration limits can be restricted to $\pm T_0/2$ .
- Inside the new integration limits ${x_{\rm P}}'(t)$ can be replaced by $x_{\rm P}(t)$ .
If we now set ${T_0}' = 2T_0$ in the above equation, we get
- $${D_{2n}}'=\frac{1}{2T_0}\cdot \int^{+T_0/2}_{-T_0/2}x_{\rm P}(t) \cdot{\rm e}^{-\rm j 2 \pi \hspace{-0.05cm}{\it n} t / T_{\rm 0}}\, {\rm d}t = {D_n}/{2} .$$
$\text{We summarize this result briefly:}$
- The spectral line of the signal ${x_{\rm P} }'(t)$ at frequency $f = n \cdot {f_0}'$ is denoted by ${D_{2n} }'$ (lower graph).
- This line is exactly half the size of the spectral line $D_n$ of the signal $x_{\rm P}(t)$ at the same physical frequency $f$ (upper graph).
- The spectral function ${X_{\rm P} }'(f)$ has opposite $X_P(f)$ additional spectral lines at $(n + 1/2) \cdot f_0$ .
- These lead to the fact that in the time domain every second „impulse” of $x_{\rm P}(t)$ um $n \cdot T_0$ located $(n$ odd$)$ is erased.
From the Periodic to the Aperiodic Signal
We now take up the considerations on the previous page and select the period duration ${T_0}'$ of ${x_{\rm P}}'(t)$ generally by an integer factor $k$ greater than the period duration $T_0$ of ${x_{\rm P}}(t)$. Then the previous statements can be generalized:
- The line spacing is smaller for ${X_{\rm P}}'(f)$ by the factor $k$ than for spectrum ${X_{\rm P}}(f)$.
- To emphasize this fact, we denote the frequency–running variable of function ${X_{\rm P}}'(f)$ with $\nu$ instead of $n$. The following applies: $\nu=k \cdot n$.
- For the spectral line of the signal ${x_{\rm P}}'(t)$ at the frequency $f=n \cdot f_0 =\nu \cdot {f_0}'$ applies:
$${D_\nu}' = {1}/{k} \cdot D_n, \hspace{0.5cm} {\rm where} \hspace{0.5cm} \nu = k \cdot n.$$
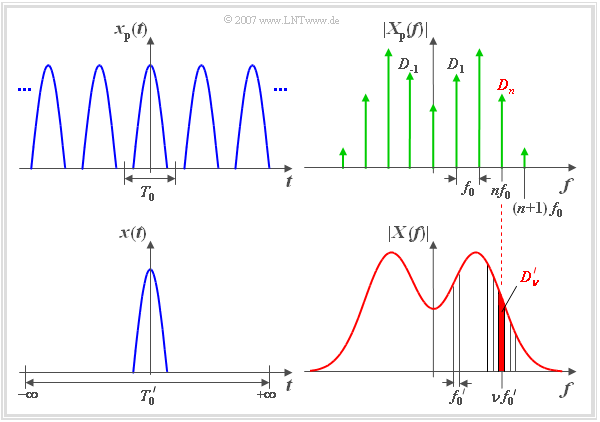
If one now chooses - as shown schematically in the picture - the factor $k$ and thus the period duration ${T_0}'$ always larger and finally lets it go to infinity, then
- the periodic signal ${x_{\rm P}}(t)$ changes to the aperiodic signal $x(t)$ ,
- the line spectrum ${X_{\rm P}}(f)$ can be replaced by the continuous spectrum $X(f)$ .
The First Fourier Integral
Concerning the spectral function $X_{\rm P}(f)$ and $X(f)$ the following statements can be made:
- The individual spectral lines now lie as close together as desired $({f_0}'=1/{T_0}' \to 0)$.
- In the spectral function $X(f)$ all possible (not only discrete) frequencies now occur within certain intervals ⇒ $X(f)$ is no longer a line spectrum.
- The contribution of each individual frequency $f$ to the signal is only negligibly small $(k \to \infty, {D_{\nu}}' \to 0)$.
- Because of the infinite number of frequencies there is a finite result in total.
- Instead of calculating the Fourier coefficients ${D_{\nu}}'$ a spectral density $X(f)$ is now calculated. For the frequency $f=\nu\cdot {f_0}'$ then applies:
- $$X(f = {\rm \nu} {f_{\rm 0}}') = \lim_{{f_{\rm 0}}' \hspace{0.05cm}\to \hspace{0.05cm} 0} ({{D_{\rm \nu}}'}/{{f_{\rm 0}}'}) = \lim_{{T_{\rm 0}}' \to \infty} ({D_{\rm \nu}}' \cdot {T_{\rm 0}}').$$
- The spectral function $X(f)$ of the aperiodic signal $x(t)$ is visible in the spectrum $X_{\rm P}(f)$ of the periodic signal $x_{\rm P}(t)$ as envelope (see graphics).
- In the lower graphic on the last page ${D_{\nu}}'$ corresponds to the red-shaded area of the frequency interval around $\nu \cdot {f_0}'$ with the width ${f_0}'$.
If you use the equations given on the last page, you get
- $$X(f = {\rm \nu} \cdot {f_{\rm 0}}') = \lim_{{T_{\rm 0}'} \to \infty} \int ^{{T_{\rm 0}}'/2} _{-{T_{\rm 0}}'/2} x_{\rm P}(t) \, \cdot \, { \rm e}^{-\rm j 2\pi\nu \it {f_{\rm 0}}' t} \,{\rm d}t.$$
Through the common limit crossing $({T_0}' \to \infty, \ {f_0}' \to 0)$ the following transformations will happen
- from the periodic signal $x_{\rm P}(t)$ the aperiodic signal $x(t)$, and
- from the discrete frequency $\nu \cdot {f_0}'$ the continuous frequency variable $f$.
Thus, a fundamental definition is obtained, which allows the calculation of the spectral function of an aperiodic time function. The name of this spectral transformation goes back to the French physicist Jean-Baptiste-Joseph Fourier .
$\text{First Fourier Integral:}$
The spectral function (or short: the spectrum ) of an aperiodic and simultaneously energy limited signal $x(t)$ is to be calculated as follows
- $$X(f)= \hspace{0.05cm}\int_{-\infty} ^{ {+}\infty} x(t) \, \cdot \, { \rm e}^{-\rm j 2\pi \it ft} \,{\rm d}t.$$
The german learning video Continuous and discrete Spectr should clarify the statements of the last pages.
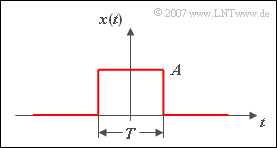
$\text{Example 2:}$ Given is the sketched time course $x(t)$. The corresponding spectrum is searched for $X(f)$.
For this we use the first Fourier integral.
- From the above representation we can see, that for $\vert t \vert > T/2$ the signal $x(t) = 0$ is
- This means that the integration interval can be limited to the range $\pm T/2$ .
- This results in the approach:
- $$ \begin{align*} X(f) & = A \cdot \int_{- T/2}^{+T/2} {\rm e}^{- {\rm j2\pi} ft}\,{\rm d}t = \frac{ A}{- \rm j2\pi f}\left[ {\rm e}^{- {\rm j}2\pi ft}\right]_{-T/2}^{+T/2} \\ & = \frac{\it A} {- \rm j 2\pi f}\cdot \big[\cos({\rm \pi} f T) - {\rm j} \cdot \sin({\rm \pi} fT) - \cos({\rm \pi} fT) - {\rm j} \cdot \sin({\rm \pi} fT)\big] \end{align*}$$
- $$\Rightarrow \hspace{0.5cm}X(f)=A\cdot \frac{\sin({\rm \pi} fT)}{ {\rm \pi} f}.$$
- If you extend numerator and denominator with $T$, you get
- $$X(f)=A\cdot T \cdot\frac{\sin(\pi fT)}{\pi fT} = A\cdot T \cdot{\rm si }(\pi fT) .$$
The function $\text{si}(x) = \sin(x)/x$ will be explained thoughtfully on the page Rectangle Pulse . Man denotes this „si function” sometimes also as „splitting function”.
Let us still consider the units of the two functions in the time and frequency domain:
- If $x(t)$ is, for example, a voltage, so the pulse amplitude $A$ has the unit "Volt".
- The dimension of the quantity $T$ is often time, for example with the unit "second".
- The reciprocal value of time is the frequency with the unit "Hertz".
- The argument $f \cdot T$ is dimensionless.
- The spectral function $X(f)$ thus has the unit "V/Hz", for example.
Fourier Transform
The spectrum $X(f)$ of a signal $x(t)$ is according to the "first fourier integral":
- $$X(f)= \hspace{0.05cm}\int _{-\infty} ^{{+}\infty} x(t) \, \cdot \, { \rm e}^{-\rm j 2\pi \it ft} \,{\rm d}t.$$
As shown on the last page with a simple example, this integral can be solved easily for an energy-limited signal $x(t)$ . For non-energy limited signals, for example
- a Direct Current Signal ,
- a harmonic oscillation, or
- a echoing signal.
we observe a divergence of the Fourier integral. Including a bilateral declining auxiliary function $\varepsilon (t)$ however, convergence can be forced:
- $$X(f) = \lim_{\varepsilon \to 0} \int _{-\infty} ^{{+}\infty} x(t) \cdot {\rm e}^{\it -\varepsilon | \hspace{0.01cm} t \hspace{0.01cm} |} \cdot {\rm e}^{{-\rm j 2 \pi}\it ft} \,{\rm d}t.$$
Such non-energy limited signals lead to so-called „Dirac functions”in the spectral domain, sometimes also called "distributions".
$\text{Definition:}$ The generally valid functional relation $X(f) = F\big [x(t) \big ]$ is called 'Fourier Transform. For the short notation we use (with the „white” dot for the time domain and the filled dot for the spectral domain):
- $$X(f)\ \bullet\!\!-\!\!\!-\!\!\!-\!\!\circ\,\ x(t).$$
With a ringing signal, however, convergence is only achieved as long as the time function increases less than exponentially
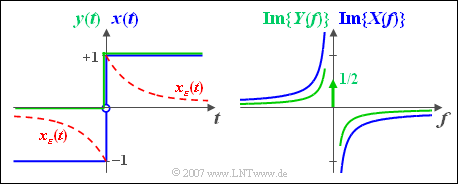
$\text{Example 3:}$ We consider an acausal jump function
- $$x (t) = \left\{ {\begin{array}{*{20}c} { +1 } & { {\rm{f\ddot{u}r} }\quad t > 0,} \\ {-1 } & { {\rm{f\ddot{u}r} }\quad t < 0.} \\\end{array} } \right.$$
This signal is shown in blue color in the left sketch.
Since the signal $x(t)$ extends to infinity on both sides,we must add a suitable convergence factor $\text{e}^{-\varepsilon \hspace{0.05cm} \cdot \hspace{0.05cm}\vert \hspace{0.05cm} t \hspace{0.05cm} \vert}$ $($ $\varepsilon > 0 is valid)$ in order to calculate the Fourier transform for both sections . The resulting time function is then
- $$x_\varepsilon (t) = \left\{ {\begin{array}{*{20}c} { {\rm{e} }^{ - \varepsilon \hspace{0.05cm} \cdot \hspace{0.05cm}t} } & { {\rm{f\ddot{u}r} }\quad t > 0,} \\ { {\rm{ - e} }^{\hspace{0.05cm}\varepsilon\hspace{0.05cm} \cdot \hspace{0.05cm} t} } & { {\rm{f\ddot{u}r} }\quad t < 0.} \\\end{array} } \right.$$
Following a similar procedure as on the page Dirac Function in the Frequency Domain results for the corresponding spectral function:
- $$X_\varepsilon (f) = \frac{1}{ {\varepsilon + {\rm{j} }2{\rm{\pi } }f} } - \frac{1}{ {\varepsilon - {\rm{j} }2{\rm{\pi } }f} } = \frac{ { - {\rm{j4\pi } }f} }{ {\varepsilon ^2 + \left( {2{\rm{\pi } }f} \right)^2 } }.$$
But actually we are interested in the spectrum of the actual jump function
- $$x(t) = \mathop {\lim }\limits_{\varepsilon \hspace{0.05cm}\to \hspace{0.05cm}0 } x_\varepsilon (t).$$
Therefore, the spectral function $X(f) =\text{F}\big[x(t)\big]$ has to be determined as limit value of $X_\varepsilon(f)$ for $\varepsilon \to 0$ :
- $$X(f) = \mathop {\lim }\limits_{\varepsilon \hspace{0.05cm} \to \hspace{0.05cm}0 } X_\varepsilon (f) = \frac{ { - {\rm{j} } } }{ { {\rm{\pi } }f} } = \frac{1}{ { {\rm{j\pi } }f} }.$$
In the right graph the imaginary spectral function $X(f)$ is shown as a blue curve. You can see that $\vert X(f) \vert$ decreases continuously with increasing frequency.
The green curve in the left graph shows the signal $y(t)$, which differs from $x(t)$ only in the negative time section.
- In this area $y(t) = 0$. The corresponding spectral function $Y(f)$ is only half as large as $X(f)$ in the entire range. This is shown in the following calculation:
- $$Y(f) = \mathop {\lim }\limits_{\varepsilon \to 0 } Y_\varepsilon (f) = \mathop {\lim }\limits_{\varepsilon \hspace{0.05cm} \to \hspace{0.05cm}0 }\frac{1}{ {\varepsilon + {\rm{j} }2{\rm{\pi } }f} } = \frac{1}{ { {\rm{j2\pi } }f} }.$$
- In addition to that there is now a Dirac function at $f = 0$ with the weight $1/2$, due to the equal part,. This is explained in detail in the example in section Mapping theorem
The Second Fourier Integral
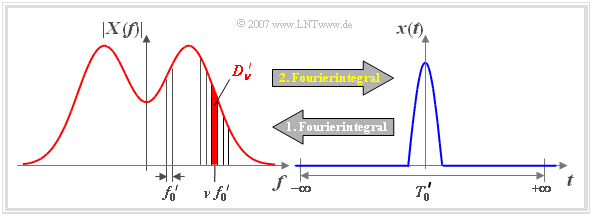
Up to now, it has only been shown how to calculate the corresponding spectral function $x(t)$ $X(f)$ for an aperiodic, pulse-shaped signal $x(t)$ . Now we turn to the reverse task, namely: How to determine the time function $x(t)$ from the spectral function $X(f)$?
With the same designations as on the first pages of this chapter, you can write the signal $x(t)$ as a Fourier series, where now the boundary ${f_0}' \to 0$ is to be considered:
- $$x(t)=\lim_{{f_{\rm 0}}' \hspace{0.05cm}\to \hspace{0.05cm}0} \sum^{+\infty}_{\nu = -\infty}{D_{\it \nu}}' \cdot \rm e^{j\hspace{0.03cm} 2 \hspace{0.03cm}\pi \hspace{0.03cm}\it\nu \hspace{0.03cm} {f_{\rm 0}}' t}.$$
If you now extend both the numerator and the denominator by ${f_0}'$, you get
- $$x(t)=\lim_{{f_{\rm 0}}' \hspace{0.05cm}\to \hspace{0.05cm}0} \sum^{+\infty}_{\nu = -\infty} ({{D_{\it \nu}}'}/{{f_{\rm 0}}'}) \cdot \rm e^{j \hspace{0.03cm}2\hspace{0.03cm} \pi \hspace{0.03cm} \it \nu \hspace{0.03cm}{f_{\rm 0}}' t} \cdot {\it f_{\rm 0}}'.$$
The limit crossing ${f_0}'. \to 0$ has the following effects:
- The (infinite) sum becomes an integral, where ${f_0}'$ has to be formally replaced by the differential quantity $\text{d}f$ (integration variable).
- The quantity $\nu \cdot{f_0}'$ in the exponent describes the physical frequency $f$.
- The quotient ${D_{\nu}}'/{f_0}'$ yields the spectral function $X(f)$ at the frequency $f$.
Taking these properties into account, the „second Fourier integral” is obtained.
$\text{Second Fourier Integral:}$ If the spectral function $X(f)$ of an aperiodic and energy-limited signal is given, then the corresponding time function is:
- $$x(t) = \hspace{0.01cm}\int_{-\infty} ^{ {+}\infty} X(f) \, \cdot \, { \rm e}^{\rm j 2\pi \it ft} \,{\rm d}f.$$
Exercises for the Chapter
Aufgabe 3.1: Spektrum des Exponentialimpulses
Aufgabe 3.1Z: Spektrum des Dreieckimpulses
Aufgabe 3.2: Vom Spektrum zum Signal
Aufgabe 3.2Z: si–Quadrat–Spektrum mit Diracs
