Difference between revisions of "Mobile Communications/Multi-Path Reception in Mobile Communications"
| (12 intermediate revisions by 2 users not shown) | |||
| Line 9: | Line 9: | ||
We assume the scenario shown in the graph. This assumes | We assume the scenario shown in the graph. This assumes | ||
[[File:EN_Mob_T_2_2_S1.png|right|frame|Time–invariant consideration of the two-way channel|class=fit]] | [[File:EN_Mob_T_2_2_S1.png|right|frame|Time–invariant consideration of the two-way channel|class=fit]] | ||
| − | *Transmitter and receiver are '''at rest''': <br>Then both the channel transfer function and the impulse response are time–independent. For all times $t$ applies $H(f, \hspace{0.05cm}t) = H(f)$ and $h(\tau, \hspace{0.05cm}t) = h(\tau)$.<br> | + | *Transmitter and receiver are »'''at rest'''«: <br>Then both the channel transfer function and the impulse response are time–independent. For all times $t$ applies $H(f, \hspace{0.05cm}t) = H(f)$ and $h(\tau, \hspace{0.05cm}t) = h(\tau)$.<br> |
| − | *A '''two-way channel''': <br>The | + | *A »'''two-way channel'''«: <br>The transmitted signal $s(t)$ reaches the receiver on a direct path with the path length $d_1$, and there is also an echo due to the reflective ground $($the total path length is $d_2)$. |
| Line 20: | Line 20: | ||
<br clear=all> | <br clear=all> | ||
The following statements should be noted: | The following statements should be noted: | ||
| − | *Compared to the | + | *Compared to the transmitted signal, the signal $r_1(t)$ received via the direct path is attenuated by the factor $k_1$ and delayed by $\tau_1$ . |
| − | *The attenuation factor $k_1$ is calculated with the [[Mobile_Communications/Distance dependent attenuation and shading#Common path loss model|path loss model]]. The greater the transmission frequency $f_{\rm S}$, the distance $d_1$ and the exponent $\gamma$ are, the smaller is $k_1$ and thus the greater is the loss. | + | *The attenuation factor $k_1$ is calculated with the [[Mobile_Communications/Distance dependent attenuation and shading#Common path loss model|$\text{path loss model}$]]. The greater the transmission frequency $f_{\rm S}$, the distance $d_1$ and the exponent $\gamma$ are, the smaller is $k_1$ and thus the greater is the loss. |
*The delay $\tau_1 = d_1/c$ increases proportionally with the path length $d_1$ . For example, for the distance $d_1 = 3 \ \rm km$ and the speed of light $c = 3 \cdot 10^8 \ \rm m/s$ the delay will be $\tau_1 = 10 \ \rm µ s$.<br> | *The delay $\tau_1 = d_1/c$ increases proportionally with the path length $d_1$ . For example, for the distance $d_1 = 3 \ \rm km$ and the speed of light $c = 3 \cdot 10^8 \ \rm m/s$ the delay will be $\tau_1 = 10 \ \rm µ s$.<br> | ||
| Line 30: | Line 30: | ||
*In addition, it must be taken into account that the reflection from buildings or the ground leads to a phase rotation of $\pi \ (180^\circ)$. This causes the factor $k_2$ to become negative. In the following, however, the negative sign of $k_2$ is ignored.<br><br> | *In addition, it must be taken into account that the reflection from buildings or the ground leads to a phase rotation of $\pi \ (180^\circ)$. This causes the factor $k_2$ to become negative. In the following, however, the negative sign of $k_2$ is ignored.<br><br> | ||
| − | <i>Note:</i> We refer here to the SWF applet [[Applets:Multipath propagation and frequency selectivity (Applet)|Multipath propagation and frequency selectivity]] '''(German language!)'''. | + | <i>Note:</i> We refer here to the SWF applet [[Applets:Multipath propagation and frequency selectivity (Applet)|"Multipath propagation and frequency selectivity"]] '''(German language!)'''. |
| Line 53: | Line 53: | ||
::<math>r(t) = s(t) + k_0 \cdot s( t - \tau_0) \hspace{0.05cm}.</math> | ::<math>r(t) = s(t) + k_0 \cdot s( t - \tau_0) \hspace{0.05cm}.</math> | ||
| − | From this simplified model (without the | + | From this simplified model (without the gray-shaded block) important descriptive variables can be easily calculated: |
| − | *If you use the [[Signal_Representation/Fourier_Transform_Theorems#Shifting_Theorem| Shifting Theorem]] you get the transfer function | + | *If you use the [[Signal_Representation/Fourier_Transform_Theorems#Shifting_Theorem| $\text{Shifting Theorem}$]] you get the transfer function |
::<math>H(f) = {R(f)}/{S(f)} = 1 + k_0 \cdot {\rm e}^{ - {\rm j} \hspace{0.05cm}\cdot \hspace{0.05cm}2 \pi f \hspace{0.05cm} \cdot \hspace{0.05cm} \tau_0} \hspace{0.05cm}.</math> | ::<math>H(f) = {R(f)}/{S(f)} = 1 + k_0 \cdot {\rm e}^{ - {\rm j} \hspace{0.05cm}\cdot \hspace{0.05cm}2 \pi f \hspace{0.05cm} \cdot \hspace{0.05cm} \tau_0} \hspace{0.05cm}.</math> | ||
| − | *Through the [[Signal_Representation/ | + | *Through the [[Signal_Representation/Fourier_Transform_and_its_Inverse#The_second_Fourier_integral|$\text{inverse Fourier transform}$]] one obtains the impulse response |
::<math>h(\tau) = 1 + k_0 \cdot \delta(\tau - \tau_0) \hspace{0.05cm}.</math> | ::<math>h(\tau) = 1 + k_0 \cdot \delta(\tau - \tau_0) \hspace{0.05cm}.</math> | ||
| Line 70: | Line 70: | ||
*The transfer function $H(f)$ and also its absolute value is periodic with $1/\tau_0 = 500 \ \rm kHz$. | *The transfer function $H(f)$ and also its absolute value is periodic with $1/\tau_0 = 500 \ \rm kHz$. | ||
| − | *This frequency period here is also the [[Mobile_Communications/The GWSSUS channel model#Parameters of the GWSSUS model|coherence bandwidth]] .<br> | + | *This frequency period here is also the [[Mobile_Communications/The GWSSUS channel model#Parameters of the GWSSUS model|$\text{coherence bandwidth}$]] .<br> |
*The fluctuations around the mean value $\vert H(f) \vert = 1$ are the stronger, the larger the (relative) contribution $k_0$ of the second path is (i.e. the echo).}}<br> | *The fluctuations around the mean value $\vert H(f) \vert = 1$ are the stronger, the larger the (relative) contribution $k_0$ of the second path is (i.e. the echo).}}<br> | ||
| Line 87: | Line 87: | ||
We now compare | We now compare | ||
| − | *the | + | *the "two-way channel" $(M = 2)$ with the parameters |
::<math>\tau_1 = 1\,\,{\rm µ s}\hspace{0.05cm}, \hspace{0.2cm} k_1 = 0.8\hspace{0.05cm}, \hspace{0.2cm} | ::<math>\tau_1 = 1\,\,{\rm µ s}\hspace{0.05cm}, \hspace{0.2cm} k_1 = 0.8\hspace{0.05cm}, \hspace{0.2cm} | ||
\tau_2 = 3\,\,{\rm µ s}\hspace{0.05cm}, \hspace{0.2cm} k_2 = 0.6</math> | \tau_2 = 3\,\,{\rm µ s}\hspace{0.05cm}, \hspace{0.2cm} k_2 = 0.6</math> | ||
| − | *and the following | + | *and the following "three-way channel" $(M = 3)$: |
:$$\tau_1 = 1\,\,{\rm µ s}\hspace{0.05cm}, \hspace{0.2cm} k_1 = 0.8\hspace{0.05cm}, \hspace{0.2cm} | :$$\tau_1 = 1\,\,{\rm µ s}\hspace{0.05cm}, \hspace{0.2cm} k_1 = 0.8\hspace{0.05cm}, \hspace{0.2cm} | ||
| Line 98: | Line 98: | ||
\hspace{0.05cm}.$$ | \hspace{0.05cm}.$$ | ||
| − | With the selected constants, both channels have the root mean square value ${\rm E}\big [k_m^2\big ] = 1$ | + | With the selected constants, both channels have the root mean square value ${\rm E}\big [k_m^2\big ] = 1$. |
The graph shows the magnitude functions $ |H(f)|$ of both channels and the corresponding impulse responses $h(\tau)$. One can see from these graphs: | The graph shows the magnitude functions $ |H(f)|$ of both channels and the corresponding impulse responses $h(\tau)$. One can see from these graphs: | ||
| − | *In the blue channel $(M = 2)$ the Dirac functions occur in a range of width $\Delta \tau_{\rm max} = 2 \ \rm µ s$. | + | *In the blue channel $(M = 2)$ the Dirac delta functions occur in a range of width $\Delta \tau_{\rm max} = 2 \ \rm µ s$. |
| − | *With the red channel $(M = 3)$ this value is four times as large: $\Delta \tau_{\rm max} = 8 \ \rm µ s$. | + | |
| + | *With the red channel $(M = 3)$ this value is four times as large: $\Delta \tau_{\rm max} = 8 \ \rm µ s$. | ||
| − | *As a first approximation for [[Mobile_Communications/The GWSSUS channel model#Parameters of the GWSSUS model|coherence bandwidth]] $B_{\rm K}\hspace{0.01cm}'\approx 1/ \Delta \tau_{\rm max}$ is often used, which may differ from the correct value by a factor of $2$ or more. | + | *As a first approximation for [[Mobile_Communications/The GWSSUS channel model#Parameters of the GWSSUS model|$\text{coherence bandwidth}$]] $B_{\rm K}\hspace{0.01cm}'\approx 1/ \Delta \tau_{\rm max}$ is often used, which may differ from the correct value by a factor of $2$ or more. |
| + | |||
*This simple approximation, marked with an apostrophe, results for the blue channel to $B_{\rm K}\hspace{0.01cm}'= 500 \ \rm kHz$. | *This simple approximation, marked with an apostrophe, results for the blue channel to $B_{\rm K}\hspace{0.01cm}'= 500 \ \rm kHz$. | ||
| + | |||
* For the red channel it is $B_{\rm K}\hspace{0.01cm}'= 125 \ \rm kHz$ which is just one fourth of the blue channel's.<br> | * For the red channel it is $B_{\rm K}\hspace{0.01cm}'= 125 \ \rm kHz$ which is just one fourth of the blue channel's.<br> | ||
| Line 111: | Line 114: | ||
{{BlaueBox|TEXT= | {{BlaueBox|TEXT= | ||
$\text{In general the following applies:} $ | $\text{In general the following applies:} $ | ||
| − | # If the signal bandwidth $B_{\rm S} = 1/T_{\rm S}$ is much smaller than the coherence bandwidth $B_{\rm K}$, then the channel can be considered as < | + | # If the signal bandwidth $B_{\rm S} = 1/T_{\rm S}$ is much smaller than the coherence bandwidth $B_{\rm K}$, then the channel can be considered as »<b>non-frequency selective</b>« <br>$(T_{\rm S}$ denotes the symbol duration$)$.<br> |
| − | # In other words: For a given $B_{\rm S}$ the smaller the coherence bandwidth $B_{\rm K}$ or the larger the maximum delay $\Delta \tau_{\rm max}$ the greater the frequency selectivity. | + | # In other words: For a given $B_{\rm S}$ the smaller the coherence bandwidth $B_{\rm K}$ or the larger the maximum delay $\Delta \tau_{\rm max}$, the greater the frequency selectivity. |
# This also means: The frequency selectivity is often determined by the longest echo. | # This also means: The frequency selectivity is often determined by the longest echo. | ||
# Many short echoes with a total energy $E$ are less disturbing than one long echo of the same energy $E$.<br>}} | # Many short echoes with a total energy $E$ are less disturbing than one long echo of the same energy $E$.<br>}} | ||
| Line 123: | Line 126: | ||
[[File:P ID3104 Mob T 2 2 S2b v1.png|right|frame|Mobile channel model considering time variance and echoes|class=fit]] | [[File:P ID3104 Mob T 2 2 S2b v1.png|right|frame|Mobile channel model considering time variance and echoes|class=fit]] | ||
| − | *The magnitudes of the complex weighting factors $z_m(t)$ are Rayleigh distributed according to the | + | *The magnitudes of the complex weighting factors $z_m(t)$ are Rayleigh distributed according to the section [[Mobile_Communications/Probability_Density_of_Rayleigh_Fading#Exemplary_signal_curves_with_Rayleigh_fading|"Exemplary signal curves with Rayleigh fading"]] or – with line-of-sight connection – Rice distributed, as described in [[Mobile_Communications/Non-Frequency_Selective_Fading_With_Direct_Component#Example_of_signal_behaviour_with_Rice_fading|"Exemplary signal curves with Rice fading"]] .<br> |
| − | *The bindings within the process $z_m(t)$ are related to the mobility properties (speed, direction, etc.) to the [[Mobile_Communications/Statistical_Bindings_within_the_Rayleigh_Process# | + | *The bindings within the process $z_m(t)$ are related to the mobility properties (speed, direction, etc.) to the [[Mobile_Communications/Statistical_Bindings_within_the_Rayleigh_Process#ACF_and_PSD_with_Rayleigh.E2.80.93Fading|$\text{Jakes Spectrum}$]] .<br><br> |
The figure shows the generally valid model for the mobile communications channel. "Generally valid" but only with reservations, as explained at the end of $\text{Example 2}$. | The figure shows the generally valid model for the mobile communications channel. "Generally valid" but only with reservations, as explained at the end of $\text{Example 2}$. | ||
| − | For an understanding of the figure we refer to the chapter [[Mobile_Communications/Probability density of Rayleigh fading#A very general description of the mobile communication channel|General description of the mobile communications channel]]. Please note: | + | For an understanding of the figure we refer to the chapter [[Mobile_Communications/Probability density of Rayleigh fading#A very general description of the mobile communication channel|"General description of the mobile communications channel"]]. Please note: |
*The $M$ main paths are characterized by large propagation time differences. | *The $M$ main paths are characterized by large propagation time differences. | ||
*The time-variant complex coefficients $z_m(t)$ result from the sum of many secondary paths whose delay times are all approximately the same $\tau_m$ . | *The time-variant complex coefficients $z_m(t)$ result from the sum of many secondary paths whose delay times are all approximately the same $\tau_m$ . | ||
| Line 136: | Line 139: | ||
$\text{Example 2:}$ Studies have shown that in mobile communications no more than four or five main pathways are effective at the same time. | $\text{Example 2:}$ Studies have shown that in mobile communications no more than four or five main pathways are effective at the same time. | ||
| − | [[File:P ID2151 Mob T 2 2 S3b v1.png|right|frame| | + | [[File:P ID2151 Mob T 2 2 S3b v1.png|right|frame|Two-dimensional impulse response with $M = 3$ paths|class=fit]] |
The represented 2D–impulse response $h(\tau,\hspace{0.1cm} t)$ applies to $M = 3$ main paths with time-variant behavior, where the received power decreases with increasing delay in the statistical average. For this graph the above sketched channel model is used as a basis. | The represented 2D–impulse response $h(\tau,\hspace{0.1cm} t)$ applies to $M = 3$ main paths with time-variant behavior, where the received power decreases with increasing delay in the statistical average. For this graph the above sketched channel model is used as a basis. | ||
| Line 144: | Line 147: | ||
*The viewing direction in the right image is rotated by $90^\circ$ . By using the color coding, the representation should be understandable.<br> | *The viewing direction in the right image is rotated by $90^\circ$ . By using the color coding, the representation should be understandable.<br> | ||
<br clear=all> | <br clear=all> | ||
| − | This | + | This graphic also shows the weak point of our mobile communications channel model: Although the coefficients $z_m(t)$ are variable, the delay times $\tau_m$ are fixed. This does not correspond to reality, if the mobile station is moving and the connection takes place in a changing environment. $\tau_m(t)$ should be considered.}}<br> |
| Line 159: | Line 162: | ||
Here, too, usually no more than $M = 5$ main paths simultaneously provide a relevant contribution to the impulse response. | Here, too, usually no more than $M = 5$ main paths simultaneously provide a relevant contribution to the impulse response. | ||
*The advantage over the first model is that for the delays now all values $\tau_m \le \tau_\text{max}$ are possible, with a temporal resolution of $\Delta \tau$ . | *The advantage over the first model is that for the delays now all values $\tau_m \le \tau_\text{max}$ are possible, with a temporal resolution of $\Delta \tau$ . | ||
| − | *At the end of next chapter [[Mobile_Communications/The GWSSUS channel model#Simulation according to the GWSSUS model|The GWSSUS channel model]] we will come back to this general model again.<br>}} | + | *At the end of next chapter [[Mobile_Communications/The GWSSUS channel model#Simulation according to the GWSSUS model|"The GWSSUS channel model"]] we will come back to this general model again.<br>}} |
| − | ==Exercises | + | ==Exercises for the chapter== |
<br> | <br> | ||
[[Aufgaben: Exercise 2.2: Simple Two-Path Channel Model]] | [[Aufgaben: Exercise 2.2: Simple Two-Path Channel Model]] | ||
| Line 169: | Line 172: | ||
[[Aufgaben:Exercise 2.3: Yet Another Multi-Path Channel]] | [[Aufgaben:Exercise 2.3: Yet Another Multi-Path Channel]] | ||
| − | [[Aufgaben:Exercise 2.4: | + | [[Aufgaben:Exercise 2.4: 2D Transfer Function]] |
Latest revision as of 14:44, 29 January 2023
Contents
Time-invariant description of the two-way channel
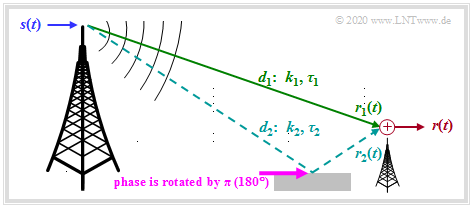
We assume the scenario shown in the graph. This assumes
- Transmitter and receiver are »at rest«:
Then both the channel transfer function and the impulse response are time–independent. For all times $t$ applies $H(f, \hspace{0.05cm}t) = H(f)$ and $h(\tau, \hspace{0.05cm}t) = h(\tau)$.
- A »two-way channel«:
The transmitted signal $s(t)$ reaches the receiver on a direct path with the path length $d_1$, and there is also an echo due to the reflective ground $($the total path length is $d_2)$.
Thus, the following applies to the received signal:
- \[r(t) = r_1(t) + r_2(t) = k_1 \cdot s( t - \tau_1) + k_2 \cdot s( t - \tau_2) \hspace{0.05cm}.\]
The following statements should be noted:
- Compared to the transmitted signal, the signal $r_1(t)$ received via the direct path is attenuated by the factor $k_1$ and delayed by $\tau_1$ .
- The attenuation factor $k_1$ is calculated with the $\text{path loss model}$. The greater the transmission frequency $f_{\rm S}$, the distance $d_1$ and the exponent $\gamma$ are, the smaller is $k_1$ and thus the greater is the loss.
- The delay $\tau_1 = d_1/c$ increases proportionally with the path length $d_1$ . For example, for the distance $d_1 = 3 \ \rm km$ and the speed of light $c = 3 \cdot 10^8 \ \rm m/s$ the delay will be $\tau_1 = 10 \ \rm µ s$.
- Because of the larger path length $(d_2 > d_1)$ the second path has a greater attenuation ⇒ smaller pre-factor ⇒ $(|k_2| < |k_1|)$ and accordingly also a greater delay $(\tau_2 > \tau_1)$.
- In addition, it must be taken into account that the reflection from buildings or the ground leads to a phase rotation of $\pi \ (180^\circ)$. This causes the factor $k_2$ to become negative. In the following, however, the negative sign of $k_2$ is ignored.
Note: We refer here to the SWF applet "Multipath propagation and frequency selectivity" (German language!).
Simple time–invariant model of the two-way channel
For the frequency selectivity
- the path loss $($marked by $k_1)$ and
- the basic term $\tau_1$
are irrelevant. The only decisive factors here are path loss differences and runtime differences.
We will now describe the two-way channel with the new parameters
- $$k_0 = |k_2 /k_1 |,\hspace{0.5cm} \tau_0 = \tau_2 - \tau_1.$$
This results in:
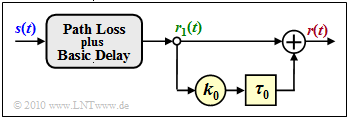
- \[r(t) = r_1(t) + k_0 \cdot r_1( t - \tau_0) \hspace{0.5cm}{\rm with} \hspace{0.5cm} r_1(t) = k_1 \cdot s( t - \tau_1)\hspace{0.05cm}.\]
The figure illustrates the equation. With the simplifications $k_1 = 1$ and $\tau_1 = 0$ ⇒ $r_1(t) = s(t)$ we obtain:
- \[r(t) = s(t) + k_0 \cdot s( t - \tau_0) \hspace{0.05cm}.\]
From this simplified model (without the gray-shaded block) important descriptive variables can be easily calculated:
- If you use the $\text{Shifting Theorem}$ you get the transfer function
- \[H(f) = {R(f)}/{S(f)} = 1 + k_0 \cdot {\rm e}^{ - {\rm j} \hspace{0.05cm}\cdot \hspace{0.05cm}2 \pi f \hspace{0.05cm} \cdot \hspace{0.05cm} \tau_0} \hspace{0.05cm}.\]
- Through the $\text{inverse Fourier transform}$ one obtains the impulse response
- \[h(\tau) = 1 + k_0 \cdot \delta(\tau - \tau_0) \hspace{0.05cm}.\]
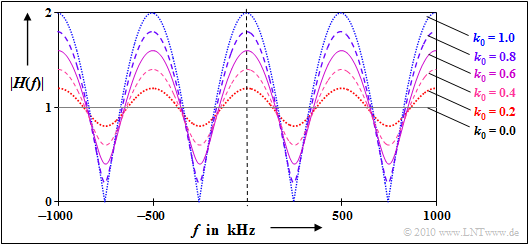
$\text{Example 1:}$ We consider a two-way channel with delay $\tau_0 = 2 \ \ \rm µ s$ and some attenuation factors $k_0$ between $0$ and $1$.
The graph shows the transfer function in terms of its absolute value in the range $\pm 1 \ \rm MHz$. You can see from this representation:
- The transfer function $H(f)$ and also its absolute value is periodic with $1/\tau_0 = 500 \ \rm kHz$.
- This frequency period here is also the $\text{coherence bandwidth}$ .
- The fluctuations around the mean value $\vert H(f) \vert = 1$ are the stronger, the larger the (relative) contribution $k_0$ of the second path is (i.e. the echo).
Coherence bandwidth as a function of M
We are now modifying the two-way model in such a way that we allow more than two paths, as is the case for mobile communications.
In general, the multipath channel model is thus:
- $$ r(t)= \sum_{m = 1}^{M}\hspace{0.15cm} k_m \cdot s( t - \tau_m)$$
- $$\Rightarrow \hspace{0.3cm} h(\tau) = \sum_{m = 1}^{M}\hspace{0.15cm} k_m \cdot \delta( \tau - \tau_m) \hspace{0.05cm}.$$
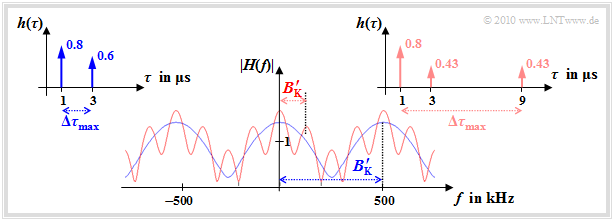
We now compare
- the "two-way channel" $(M = 2)$ with the parameters
- \[\tau_1 = 1\,\,{\rm µ s}\hspace{0.05cm}, \hspace{0.2cm} k_1 = 0.8\hspace{0.05cm}, \hspace{0.2cm} \tau_2 = 3\,\,{\rm µ s}\hspace{0.05cm}, \hspace{0.2cm} k_2 = 0.6\]
- and the following "three-way channel" $(M = 3)$:
- $$\tau_1 = 1\,\,{\rm µ s}\hspace{0.05cm}, \hspace{0.2cm} k_1 = 0.8\hspace{0.05cm}, \hspace{0.2cm} \tau_2 = 3\,\,{\rm µ s}\hspace{0.05cm}, \hspace{0.2cm} k_2 \approx 0.43\hspace{0.05cm}, \hspace{0.2cm} \tau_3 = 9\,\,{\rm µ s}\hspace{0.05cm}, \hspace{0.2cm} k_3 \approx 0.43 \hspace{0.05cm}.$$
With the selected constants, both channels have the root mean square value ${\rm E}\big [k_m^2\big ] = 1$.
The graph shows the magnitude functions $ |H(f)|$ of both channels and the corresponding impulse responses $h(\tau)$. One can see from these graphs:
- In the blue channel $(M = 2)$ the Dirac delta functions occur in a range of width $\Delta \tau_{\rm max} = 2 \ \rm µ s$.
- With the red channel $(M = 3)$ this value is four times as large: $\Delta \tau_{\rm max} = 8 \ \rm µ s$.
- As a first approximation for $\text{coherence bandwidth}$ $B_{\rm K}\hspace{0.01cm}'\approx 1/ \Delta \tau_{\rm max}$ is often used, which may differ from the correct value by a factor of $2$ or more.
- This simple approximation, marked with an apostrophe, results for the blue channel to $B_{\rm K}\hspace{0.01cm}'= 500 \ \rm kHz$.
- For the red channel it is $B_{\rm K}\hspace{0.01cm}'= 125 \ \rm kHz$ which is just one fourth of the blue channel's.
$\text{In general the following applies:} $
- If the signal bandwidth $B_{\rm S} = 1/T_{\rm S}$ is much smaller than the coherence bandwidth $B_{\rm K}$, then the channel can be considered as »non-frequency selective«
$(T_{\rm S}$ denotes the symbol duration$)$. - In other words: For a given $B_{\rm S}$ the smaller the coherence bandwidth $B_{\rm K}$ or the larger the maximum delay $\Delta \tau_{\rm max}$, the greater the frequency selectivity.
- This also means: The frequency selectivity is often determined by the longest echo.
- Many short echoes with a total energy $E$ are less disturbing than one long echo of the same energy $E$.
Consideration of the time variance
Up to now the attenuation factors $k_m$ were assumed to be constant. For mobile radio, however, this channel model is only correct if transmitter and receiver are static, which is merely a special case for this communication system.
For a moving user, these constant factors $k_m$ must be replaced by the time-variant factors $z_m(t)$ which are each based on random processes. You should note this:
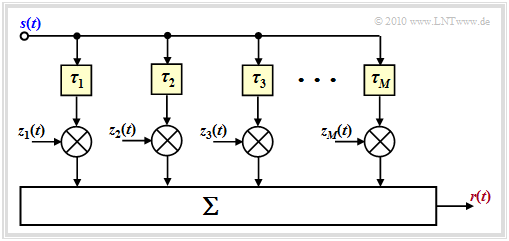
- The magnitudes of the complex weighting factors $z_m(t)$ are Rayleigh distributed according to the section "Exemplary signal curves with Rayleigh fading" or – with line-of-sight connection – Rice distributed, as described in "Exemplary signal curves with Rice fading" .
- The bindings within the process $z_m(t)$ are related to the mobility properties (speed, direction, etc.) to the $\text{Jakes Spectrum}$ .
The figure shows the generally valid model for the mobile communications channel. "Generally valid" but only with reservations, as explained at the end of $\text{Example 2}$.
For an understanding of the figure we refer to the chapter "General description of the mobile communications channel". Please note:
- The $M$ main paths are characterized by large propagation time differences.
- The time-variant complex coefficients $z_m(t)$ result from the sum of many secondary paths whose delay times are all approximately the same $\tau_m$ .
$\text{Example 2:}$ Studies have shown that in mobile communications no more than four or five main pathways are effective at the same time.
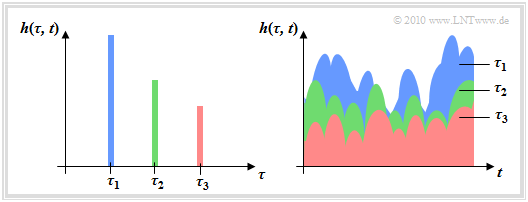
The represented 2D–impulse response $h(\tau,\hspace{0.1cm} t)$ applies to $M = 3$ main paths with time-variant behavior, where the received power decreases with increasing delay in the statistical average. For this graph the above sketched channel model is used as a basis.
Two different views are shown:
- The left image shows $h(\tau,\hspace{0.1cm} t)$ as a function of the delay time $\tau$ at a fixed time $t$.
- The viewing direction in the right image is rotated by $90^\circ$ . By using the color coding, the representation should be understandable.
This graphic also shows the weak point of our mobile communications channel model: Although the coefficients $z_m(t)$ are variable, the delay times $\tau_m$ are fixed. This does not correspond to reality, if the mobile station is moving and the connection takes place in a changing environment. $\tau_m(t)$ should be considered.
$\text{Conclusion:}$ It is helpful to make a slight modification to the above model:
- One chooses the number $M'$ of (possible) main paths much larger than necessary and sets $\tau_m = m \cdot \Delta \tau$.
- The incremental (minimum resolvable) delay $\Delta \tau = T_{\rm S}$ results from the sampling rate and thus from the bandwidth $B_{\rm S} = 1/T_{\rm S}$ of the signal $s(t)$.
- The maximum delay time $\tau_\text{max} = M' \cdot \Delta \tau$ of this model is equal to the inverse of the coherence bandwidth $B_{\rm K}$. The number of paths considered is thus $M' = B_{\rm S}/B_{\rm K}$.
Here, too, usually no more than $M = 5$ main paths simultaneously provide a relevant contribution to the impulse response.
- The advantage over the first model is that for the delays now all values $\tau_m \le \tau_\text{max}$ are possible, with a temporal resolution of $\Delta \tau$ .
- At the end of next chapter "The GWSSUS channel model" we will come back to this general model again.
Exercises for the chapter
Exercise 2.2: Simple Two-Path Channel Model
Exercise 2.2Z: Real Two-Path Channel
Exercise 2.3: Yet Another Multi-Path Channel
Exercise 2.4: 2D Transfer Function
