Difference between revisions of "Applets:PDF, CDF and Moments of Special Distributions"
| Line 176: | Line 176: | ||
| − | [[File:Gauss_Signal.png|right|frame| Signal | + | [[File:Gauss_Signal.png|right|frame| Signal and PDF of a Gaussian noise signal]] |
{{GraueBox|TEXT= | {{GraueBox|TEXT= | ||
| − | $\text{ | + | $\text{Example 1:}$ The graphic shows a section of a stochastic noise signal $x(t)$ whose instantaneous value can be taken as a continuous random variable $X$. From the PDF shown on the right, it can be seen that: |
| − | * | + | * A Gaussian random variable is present. |
| − | * | + | *Instantaneous values around the mean $m_X$ occur most frequently. |
| − | * | + | *If there are no statistical ties between the samples $x_ν$ of the sequence, such a signal is also called ''"white noise".''}} |
Revision as of 13:12, 23 February 2023
Open Applet in new Tab Deutsche Version Öffnen
Contents
Applet Description
The applet presents the description forms of two continuous value random variables $X$ and $Y\hspace{-0.1cm}$. For the red random variable $X$ and the blue random variable $Y$, the following basic forms are available for selection:
- Gaussian distribution, uniform distribution, triangular distribution, exponential distribution, Laplace distribution, Rayleigh distribution, Rice distribution, Weibull distribution, Wigner semicircle distribution, Wigner parabolic distribution, Cauchy distribution.
The following data refer to the random variables $X$. Graphically represented are
- the probability density function $f_{X}(x)$ (above) and
- the cumulative distribution function $F_{X}(x)$ (bottom).
In addition, some integral parameters are output, namely
- the linear mean value $m_X = {\rm E}\big[X \big]$,
- the quadratic mean value $P_X ={\rm E}\big[X^2 \big] $,
- the variance $\sigma_X^2 = P_X - m_X^2$,
- the standard deviation $\sigma_X$,
- the Charlier skewness $S_X$,
- the kurtosis $K_X$.
Definition and Properties of the Presented Descriptive Variables
In this applet we consider only (value–)continuous random variables, i.e. those whose possible numerical values are not countable.
- The range of values of these random variables is thus in general that of the real numbers $(-\infty \le X \le +\infty)$.
- However, it is possible that the range of values is limited to an interval: $x_{\rm min} \le X \le +x_{\rm max}$.
Probability density function (PDF)
For a continuous random variable $X$ the probabilities that $X$ takes on quite specific values $x$ are zero: ${\rm Pr}(X= x) \equiv 0$. Therefore, to describe a continuous random variable, we must always refer to the probability density function – in short $\rm PDF$.
$\text{Definition:}$ The value of the »probability density function« $f_{X}(x)$ at location $x$ is equal to the probability that the instantaneous value of the random variable $x$ lies in an (infinitesimally small) interval of width $Δx$ around $x_\mu$, divided by $Δx$:
- $$f_X(x) = \lim_{ {\rm \Delta} x \hspace{0.05cm}\to \hspace{0.05cm} 0} \frac{ {\rm Pr} \big [x - {\rm \Delta} x/2 \le X \le x +{\rm \Delta} x/2 \big ] }{ {\rm \Delta} x}.$$
This extremely important descriptive variable has the following properties:
- For the probability that the random variable $X$ lies in the range between $x_{\rm u}$ and $x_{\rm o} > x_{\rm u}$:
- $${\rm Pr}(x_{\rm u} \le X \le x_{\rm o}) = \int_{x_{\rm u}}^{x_{\rm o}} f_{X}(x) \ {\rm d}x.$$
- As an important normalization property, this yields for the area under the PDF with the boundary transitions $x_{\rm u} → \hspace{0.1cm} – \hspace{0.05cm} ∞$ and $x_{\rm o} → +∞$:
- $$\int_{-\infty}^{+\infty} f_{X}(x) \ {\rm d}x = 1.$$
Cumulative distribution function (CDF)
The cumulative distribution function – in short $\rm CDF$ – provides the same information about the random variable $X$ as the probability density function.
$\text{Definition:}$ The »cumulative distribution function« $F_{X}(x)$ corresponds to the probability that the random variable $X$ is less than or equal to a real number $x$:
- $$F_{X}(x) = {\rm Pr}( X \le x).$$
The CDF has the following characteristics:
- The CDF is computable from the probability density function $f_{X}(x)$ by integration. It holds:
- $$F_{X}(x) = \int_{-\infty}^{x}f_X(\xi)\,{\rm d}\xi.$$
- Since the PDF is never negative, $F_{X}(x)$ increases at least weakly monotonically, and always lies between the following limits:
- $$F_{X}(x → \hspace{0.1cm} – \hspace{0.05cm} ∞) = 0, \hspace{0.5cm}F_{X}(x → +∞) = 1.$$
- Inversely, the probability density function can be determined from the CDF by differentiation:
- $$f_{X}(x)=\frac{{\rm d} F_{X}(\xi)}{{\rm d}\xi}\Bigg |_{\hspace{0.1cm}x=\xi}.$$
- For the probability that the random variable $X$ is in the range between $x_{\rm u}$ and $x_{\rm o} > x_{\rm u}$ holds:
- $${\rm Pr}(x_{\rm u} \le X \le x_{\rm o}) = F_{X}(x_{\rm o}) - F_{X}(x_{\rm u}).$$
Expected values and moments
The probability density function provides very extensive information about the random variable under consideration. Less, but more compact information is provided by the so-called "expected values" and "moments".
$\text{Definition:}$ The »expected value« with respect to any weighting function $g(x)$ can be calculated with the PDF $f_{\rm X}(x)$ in the following way:
- $${\rm E}\big[g (X ) \big] = \int_{-\infty}^{+\infty} g(x)\cdot f_{X}(x) \,{\rm d}x.$$
Substituting into this equation for $g(x) = x^k$ we get the »moment of $k$-th order«:
- $$m_k = {\rm E}\big[X^k \big] = \int_{-\infty}^{+\infty} x^k\cdot f_{X} (x ) \, {\rm d}x.$$
From this equation follows.
- with $k = 1$ for the first order moment or the (linear) mean:
- $$m_1 = {\rm E}\big[X \big] = \int_{-\infty}^{ \rm +\infty} x\cdot f_{X} (x ) \,{\rm d}x,$$
- with $k = 2$ for the second order moment or the second moment:
- $$m_2 = {\rm E}\big[X^{\rm 2} \big] = \int_{-\infty}^{ \rm +\infty} x^{ 2}\cdot f_{ X} (x) \,{\rm d}x.$$
In relation to signals, the following terms are also common:
- $m_1$ indicates the DC component; with respect to the random quantity $X$ in the following we also write $m_X$.
- $m_2$ corresponds to the signal power $P_X$ (referred to the unit resistance $1 \ Ω$ ) .
For example, if $X$ denotes a voltage, then according to these equations $m_X$ has the unit ${\rm V}$ and the power $P_X$ has the unit ${\rm V}^2.$ If the power is to be expressed in "watts" $\rm (W)$, then $P_X$ must be divided by the resistance value $R$.
Central moments
Of particular importance in statistics in general are the so-called central moments from which many characteristics are derived,
$\text{Definition:}$ The »central moments«, in contrast to the conventional moments, are each related to the mean value $m_1$ in each case. For these, the following applies with $k = 1, \ 2,$ ...:
- $$\mu_k = {\rm E}\big[(X-m_{\rm 1})^k\big] = \int_{-\infty}^{+\infty} (x-m_{\rm 1})^k\cdot f_x(x) \,\rm d \it x.$$
- For mean-free random variables, the central moments $\mu_k$ coincide with the noncentral moments $m_k$.
- The first order central moment is by definition equal to $\mu_1 = 0$.
- The noncentral moments $m_k$ and the central moments $\mu_k$ can be converted directly into each other. With $m_0 = 1$ and $\mu_0 = 1$ it is valid:
- $$\mu_k = \sum\limits_{\kappa= 0}^{k} \left( \begin{array}{*{2}{c}} k \\ \kappa \\ \end{array} \right)\cdot m_\kappa \cdot (-m_1)^{k-\kappa},$$
- $$m_k = \sum\limits_{\kappa= 0}^{k} \left( \begin{array}{*{2}{c}} k \\ \kappa \\ \end{array} \right)\cdot \mu_\kappa \cdot {m_1}^{k-\kappa}.$$
Some Frequently Used Central Moments
From the last definition the following additional characteristics can be derived:
$\text{Definition:}$ The »variance« of the considered random variable $X$ is the second order central moment:
- $$\mu_2 = {\rm E}\big[(X-m_{\rm 1})^2\big] = \sigma_X^2.$$
- The variance $σ_X^2$ corresponds physically to the "switching power" and »standard deviation« $σ_X$ gives the "rms value".
- From the linear and the second moment, the variance can be calculated according to Steiner's theorem in the following way: $\sigma_X^{2} = {\rm E}\big[X^2 \big] - {\rm E}^2\big[X \big].$
$\text{Definition:}$ The »Charlier's skewness« $S_X$ of the considered random variable $X$ denotes the third central moment related to $σ_X^3$.
- For symmetric probability density function, this parameter $S_X$ is always zero.
- The larger $S_X = \mu_3/σ_X^3$ is, the more asymmetric is the PDF around the mean $m_X$.
- For example, for the exponential distribution the (positive) skewness $S_X =2$, and this is independent of the distribution parameter $λ$.
$\text{Definition:}$ The »kurtosis« of the considered random variable $X$ is the quotient $K_X = \mu_4/σ_X^4$ $(\mu_4:$ fourth-order central moment$)$.
- For a Gaussian distributed random variable this always yields the value $K_X = 3$.
- This parameter can be used, for example, to check whether a given random variable is actually Gaussian or can at least be approximated by a Gaussian distribution.
Compilation of some Continuous–Value Random Variables
The applet considers the following distributions:
- Gaussian distribution, uniform distribution, triangular distribution, exponential distribution, Laplace distribution, Rayleigh distribution,
Rice distribution, Weibull distribution, Wigner semicircle distribution, Wigner parabolic distribution, Cauchy distribution.
Some of these will be described in detail here.
Gaussian distributed random variables
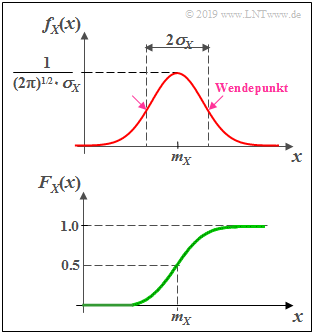
(1) »Probability density function« $($axisymmetric around $m_X)$
- $$f_X(x) = \frac{1}{\sqrt{2\pi}\cdot\sigma_X}\cdot {\rm e}^{-(X-m_X)^2 /(2\sigma_X^2) }.$$
PDF parameters:
- $m_X$ (mean or DC component),
- $σ_X$ (standard deviation or rms value).
(2) »Cumulative distribution function« $($point symmetric around $m_X)$
- $$F_X(x)= \phi(\frac{\it x-m_X}{\sigma_X})\hspace{0.5cm}\rm with\hspace{0.5cm}\rm \phi (\it x\rm ) = \frac{\rm 1}{\sqrt{\rm 2\it \pi}}\int_{-\rm\infty}^{\it x} \rm e^{\it -u^{\rm 2}/\rm 2}\,\, d \it u.$$
$ϕ(x)$: Gaussian error integral (cannot be calculated analytically, must be taken from tables).
(3) »Central moments«
- $$\mu_{k}=(k- 1)\cdot (k- 3) \ \cdots \ 3\cdot 1\cdot\sigma_X^k\hspace{0.2cm}\rm (if\hspace{0.2cm}\it k\hspace{0.2cm}\rm even).$$
- Charlier's skewness $S_X = 0$, since $\mu_3 = 0$ $($PDF is symmetric about $m_X)$.
- Kurtosis $K_X = 3$, since $\mu_4 = 3 \cdot \sigma_X^2$ ⇒ $K_X = 3$ results only for the Gaussian PDF.
(4) »Further remarks«
- The naming is due to the important mathematician, physicist and astronomer Carl Friedrich Gauss.
- If $m_X = 0$ and $σ_X = 1$, it is often referred to as the normal distribution.
- The standard deviation can also be determined graphically from the bell-shaped PDF $f_{X}(x)$ (as the distance between the maximum value and the point of inflection).
- Random quantities with Gaussian WDF are realistic models for many physical physical quantities and also of great importance for communications engineering.
- The sum of many small and independent components always leads to the Gaussian PDF ⇒ Central Limit Theorem of Statistics ⇒ Basis for noise processes.
- If one applies a Gaussian distributed signal to a linear filter for spectral shaping, the output signal is also Gaussian distributed.
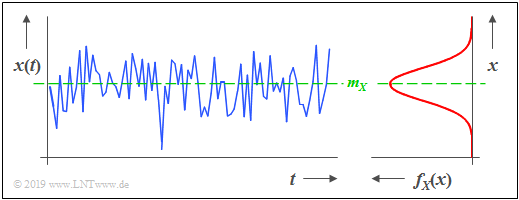
$\text{Example 1:}$ The graphic shows a section of a stochastic noise signal $x(t)$ whose instantaneous value can be taken as a continuous random variable $X$. From the PDF shown on the right, it can be seen that:
- A Gaussian random variable is present.
- Instantaneous values around the mean $m_X$ occur most frequently.
- If there are no statistical ties between the samples $x_ν$ of the sequence, such a signal is also called "white noise".
Gleichverteilte Zufallsgrößen
(1) »Wahrscheinlichkeitsdichtefunktion«
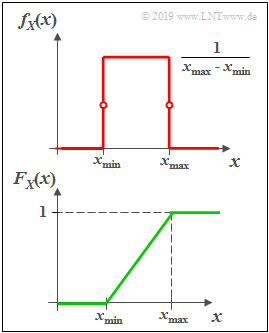
- Die Wahrscheinlichkeitsdichtefunktion (WDF) $f_{X}(x)$ ist im Bereich von $x_{\rm min}$ bis $x_{\rm max}$ konstant gleich $1/(x_{\rm max} - x_{\rm min})$ und außerhalb Null.
- An den Bereichsgrenzen ist für $f_{X}(x)$ jeweils nur der halbe Wert (Mittelwert zwischen links- und rechtsseitigem Grenzwert) zu setzen.
(2) »Verteilungsfunktion«
- Die Verteilungsfunktion (VTF) steigt im Bereich von $x_{\rm min}$ bis $x_{\rm max}$ linear von Null auf $1$ linear an.
(3) »Momente und Zentralmomente«
- Mittelwert und Streuung haben bei der Gleichverteilung die folgenden Werte:
- $$m_X = \frac{\it x_ {\rm max} \rm + \it x_{\rm min}}{2},\hspace{0.5cm} \sigma_X^2 = \frac{(\it x_{\rm max} - \it x_{\rm min}\rm )^2}{12}.$$
- Bei symmetrischer WDF ⇒ $x_{\rm min} = -x_{\rm max}$ ist der Mittelwert $m_X = 0$ und die Varianz $σ_X^2 = x_{\rm max}^2/3.$
- Aufgrund der Symmetrie um den Mittelwert $m_X$ ist die Charliersche Schiefe $S_X = 0$.
- Die Kurtosis ist mit $K_X = 1.8$ deutlich kleiner als bei der Gaußverteilung, weil die WDF–Ausläufer fehlen.
(4) »Weitere Bemerkungen«
- Für die Modellierung übertragungstechnischer Systeme sind gleichverteilte Zufallsgrößen die Ausnahme. Ein Beispiel für eine tatsächlich (nahezu) gleichverteilte Zufallsgröße ist die Phase bei kreissymmetrischen Störungen, wie sie beispielsweise bei Quadratur–Amplitudenmodulationsverfahren (QAM) auftreten.
- Die Bedeutung gleichverteilter Zufallsgrößen für die Informations– und Kommunikationstechnik liegt eher darin, dass diese WDF–Form aus Sicht der Informationstheorie unter der Nebenbedingung "Spitzenwertbegrenzung" ein Optimum bezüglich der differentiellen Entropie darstellt.
- In der Bildverarbeitung & Bildcodierung wird häufig mit der Gleichverteilung anstelle der tatsächlichen, meist sehr viel komplizierteren Verteilung des Originalbildes gerechnet, da der Unterschied des Informationsgehaltes zwischen einem natürlichen Bild und dem auf der Gleichverteilung basierenden Modell relativ gering ist.
- Bei der Simulation nachrichtentechnischer Systeme verwendet man häufig auf der Gleichverteilung basierende "Pseudo–Zufallsgeneratoren" (die relativ einfach zu realisieren sind), woraus sich andere Verteilungen (Gaußverteilung, Exponentialverteilung, etc.) leicht ableiten lassen.
Exponentialverteilte Zufallsgrößen
(1) »Wahrscheinlichkeitsdichtefunktion«
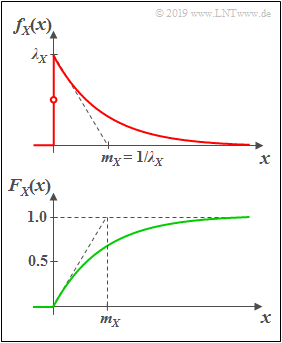
Eine exponentialverteilte Zufallsgröße $X$ kann nur nicht–negative Werte annehmen. Für $x>0$ hat die WDF den folgenden Verlauf hat:
- $$f_X(x)=\it \lambda_X\cdot\rm e^{\it -\lambda_X \hspace{0.05cm}\cdot \hspace{0.03cm} x}.$$
- Je größer der Verteilungsparameter $λ_X$ ist, um so steiler erfolgt der Abfall.
- Definitionsgemäß gilt $f_{X}(0) = λ_X/2$, also der Mittelwert aus linksseitigem Grenzwert $(0)$ und rechtsseitigem Grenzwert $(\lambda_X)$.
(2) »Verteilungsfunktion«
Durch Integration über die WDF erhält man für $x > 0$:
- $$F_{X}(x)=1-\rm e^{\it -\lambda_X\hspace{0.05cm}\cdot \hspace{0.03cm} x}.$$
(3) »Momente und Zentralmomente«
- Die Momente der (einseitigen) Exponentialverteilung sind allgemein gleich:
- $$m_k = \int_{-\infty}^{+\infty} x^k \cdot f_{X}(x) \,\,{\rm d} x = \frac{k!}{\lambda_X^k}.$$
- Daraus und aus dem Satz von Steiner ergibt sich für Mittelwert und Streuung:
- $$m_X = m_1=\frac{1}{\lambda_X},\hspace{0.6cm}\sigma_X^2={m_2-m_1^2}={\frac{2}{\lambda_X^2}-\frac{1}{\lambda_X^2}}=\frac{1}{\lambda_X^2}.$$
- Die WDF ist hier deutlich unsymmetrisch. Für die Charliersche Schiefe ergibt sich $S_X = 2$.
- Die Kurtosis ist mit $K_X = 9$ deutlich größer als bei der Gaußverteilung, weil die WDF–Ausläufer sehr viel weiter reichen.
(4) »Weitere Bemerkungen«
- Die Exponentialverteilung hat große Bedeutung für Zuverlässigkeitsuntersuchungen; in diesem Zusammenhang ist auch der Begriff "Lebensdauerverteilung" üblich.
- Bei diesen Anwendungen ist die Zufallsgröße oft die Zeit $t$, die bis zum Ausfall einer Komponente vergeht.
- Desweiteren ist anzumerken, dass die Exponentialverteilung eng mit der Laplaceverteilung in Zusammenhang steht.
Laplaceverteilte Zufallsgrößen
(1) »Wahrscheinlichkeitsdichtefunktion«
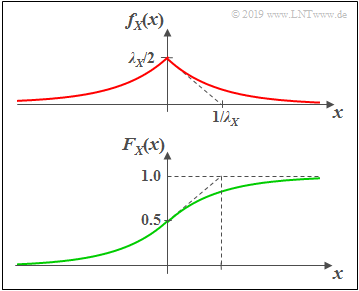
Wie aus der Grafik zu ersehen ist die Laplaceverteilung eine "zweiseitige Exponentialverteilung":
- $$f_{X}(x)=\frac{\lambda_X} {2}\cdot{\rm e}^ { - \lambda_X \hspace{0.05cm} \cdot \hspace{0.05cm} \vert \hspace{0.05cm} x \hspace{0.05cm} \vert}.$$
- Der Maximalwert ist hier $\lambda_X/2$.
- Die Tangente bei $x=0$ schneidet die Abszisse wie bei der Exponentialverteilung bei $1/\lambda_X$.
(2) »Verteilungsfunktion«
- $$F_{X}(x) = {\rm Pr}\big [X \le x \big ] = \int_{-\infty}^{x} f_{X}(\xi) \,\,{\rm d}\xi $$
- $$\Rightarrow \hspace{0.5cm} F_{X}(x) = 0.5 + 0.5 \cdot {\rm sign}(x) \cdot \big [ 1 - {\rm e}^ { - \lambda_X \hspace{0.05cm} \cdot \hspace{0.05cm} \vert \hspace{0.05cm} x \hspace{0.05cm} \vert}\big ] $$
- $$\Rightarrow \hspace{0.5cm} F_{X}(-\infty) = 0, \hspace{0.5cm}F_{X}(0) = 0.5, \hspace{0.5cm} F_{X}(+\infty) = 1.$$
(3) »Momente und Zentralmomente«
- Für ungeradzahliges $k$ ergibt sich bei der Laplaceverteilung aufgrund der Symmetrie stets $m_k= 0$. Unter Anderem: Linearer Mittelwert $m_X =m_1 = 0$.
- Für geradzahliges $k$ stimmen die Momente von Laplaceverteilung und Exponentialverteilung überein: $m_k = {k!}/{\lambda^k}$.
- Für die Varianz $(=$ Zentralmoment zweiter Ordnung $=$ Moment zweiter Ordnung$)$ gilt: $\sigma_X^2 = {2}/{\lambda_X^2}$ ⇒ doppelt so groß wie bei der Exponentialverteilung.
- Für die Charliersche Schiefe ergibt sich hier aufgrund der symmetrischen WDF $S_X = 0$.
- Die Kurtosis ist mit $K_X = 6$ deutlich größer als bei der Gaußverteilung, aber kleiner als bei der Exponentialverteilung.
(4) »Weitere Bemerkungen«
- Die Momentanwerte von Sprach– und Musiksignalen sind mit guter Näherung laplaceverteilt.
Siehe Lernvideo "Wahrscheinlichkeit und Wahrscheinlichkeitsdichtefunktion", Teil 2. - Durch eine zusätzliche Diracfunktion bei $x=0$ lassen sich auch Sprachpausen modellieren.
Kurzbeschreibung weiterer Verteilungen
$\text{(A) Rayleighverteilung}$ $\text{Genauere Beschreibung}$
- Wahrscheinlichkeitsdichtefunktion:
- $$f_X(x) = \left\{ \begin{array}{c} x/\lambda_X^2 \cdot {\rm e}^{- x^2/(2 \hspace{0.05cm}\cdot\hspace{0.05cm} \lambda_X^2)} \\ 0 \end{array} \right.\hspace{0.15cm} \begin{array}{*{1}c} {\rm f\ddot{u}r}\hspace{0.1cm} x\hspace{-0.05cm} \ge \hspace{-0.05cm}0, \\ {\rm f\ddot{u}r}\hspace{0.1cm} x \hspace{-0.05cm}<\hspace{-0.05cm} 0. \\ \end{array}.$$
- Anwendung: Modellierung des Mobilfunkkanals (nichtfrequenzselektives Fading, nur Dämpfungs–, Beugungs– und Brechungseffekte, keine Sichtverbindung).
$\text{(B) Riceverteilung}$ $\text{Genauere Beschreibung}$
- Wahrscheinlichkeitsdichtefunktion $(\rm I_0$ bezeichnet die modifizierte Bessel–Funktion nullter Ordnung$)$:
- $$f_X(x) = \frac{x}{\lambda_X^2} \cdot {\rm exp} \big [ -\frac{x^2 + C_X^2}{2\cdot \lambda_X^2}\big ] \cdot {\rm I}_0 \left [ \frac{x \cdot C_X}{\lambda_X^2} \right ]\hspace{0.5cm}\text{mit}\hspace{0.5cm}{\rm I }_0 (u) = {\rm J }_0 ({\rm j} \cdot u) = \sum_{k = 0}^{\infty} \frac{ (u/2)^{2k}}{k! \cdot \Gamma (k+1)} \hspace{0.05cm}.$$
- Anwendung: Modellierung des Mobilfunkkanals (nichtfrequenzselektives Fading, nur Dämpfungs–, Beugungs– und Brechungseffekte, mit Sichtverbindung).
$\text{(C) Weibullverteilung}$ [$\text{Genauere Beschreibung}$]
- Wahrscheinlichkeitsdichtefunktion:
- $$f_X(x) = \lambda_X \cdot k_X \cdot (\lambda_X \cdot x)^{k_X-1} \cdot {\rm e}^{(\lambda_X \cdot x)^{k_X}} \hspace{0.05cm}.$$
- Anwendung: WDF mit einstellbarer Schiefe $S_X$; Exponentialverteilung $(k_X = 1)$ und Rayleighverteilung $(k_X = 2)$ als Sonderfälle enthalten.
$\text{(D) Wigner-Halbkreisverteilung}$ [$\text{Genauere Beschreibung}$]
- Wahrscheinlichkeitsdichtefunktion:
- $$f_X(x) = \left\{ \begin{array}{c} 2/(\pi \cdot {R_X}^2) \cdot \sqrt{{R_X}^2 - (x- m_X)^2} \\ 0 \end{array} \right.\hspace{0.15cm} \begin{array}{*{1}c} {\rm f\ddot{u}r}\hspace{0.1cm} |x- m_X|\hspace{-0.05cm} \le \hspace{-0.05cm}R_X, \\ {\rm f\ddot{u}r}\hspace{0.1cm} |x- m_X| \hspace{-0.05cm} > \hspace{-0.05cm} R_X \\ \end{array}.$$
- Anwendung: WDF der Tschebyscheff–Knoten ⇒ Nullstellen der Tschebyscheff–Polynome aus der Numerik.
$\text{(E) Wigner-Parabelverteilung}$
- Wahrscheinlichkeitsdichtefunktion:
- $$f_X(x) = \left\{ \begin{array}{c} 3/(4 \cdot {R_X}^3) \cdot \big ({R_X}^2 - (x- m_X)^2\big ) \\ 0 \end{array} \right.\hspace{0.15cm} \begin{array}{*{1}c} {\rm f\ddot{u}r}\hspace{0.1cm} |x|\hspace{-0.05cm} \le \hspace{-0.05cm}R_X, \\ {\rm f\ddot{u}r}\hspace{0.1cm} |x| \hspace{-0.05cm} > \hspace{-0.05cm} R_X \\ \end{array}.$$
- Anwendung: WDF der Eigenwerte von symmetrischen Zufallsmatrizen, deren Dimension gegen unendlich geht.
$\text{(F) Cauchyverteilung}$ $\text{Genauere Beschreibung}$
- Wahrscheinlichkeitsdichtefunktion und Verteilungsfunktion:
- $$f_{X}(x)=\frac{1}{\pi}\cdot\frac{\lambda_X}{\lambda_X^2+x^2}, \hspace{2cm} F_{X}(x)={\rm 1}/{2}+{\rm arctan}({x}/{\lambda_X}).$$
- Bei der Cauchyverteilung besitzen alle Momente $m_k$ für gerades $k$ einen unendlich großen Wert, und zwar unabhängig vom Parameter $λ_X$.
- Damit besitzt diese Verteilung auch eine unendlich große Varianz: $\sigma_X^2 \to \infty$.
- Aufgrund der Symmetrie sind für ungerades $k$ alle Momente $m_k = 0$, wenn man wie im Programm vom "Cauchy Principal Value" ausgeht: $m_X = 0, \ S_X = 0$.
- Beispiel: Der Quotient zweier Gaußscher mittelwertfreier Zufallsgrößen ist cauchyverteilt. Für praktische Anwendungen hat die Cauchyverteilung weniger Bedeutung.
Exercises
- First, select the number $(1,\ 2, \text{...} \ )$ of the task to be processed. The number "$0$" corresponds to a "Reset": Same setting as at program start.
- A task description is displayed. The parameter values are adjusted. Solution after pressing "Show Solution".
- In the following $\text{Red}$ stands for the random variable $X$ and $\text{Blue}$ for $Y$.
(1) Select $\text{red: Gaussian PDF}\ (m_X = 1, \ \sigma_X = 0.4)$ and $\text{blue: Rectangular PDF}\ (y_{\rm min} = -2, \ y_{\rm max} = +3)$. Interpret the $\rm PDF$ graph.
- $\text{Gaussian PDF}$: The $\rm PDF$ maximum is equal to $f_{X}(x = m_X) = \sqrt{1/(2\pi \cdot \sigma_X^2)} = 0.9974 \approx 1$.
- $\text{Rectangular PDF}$: All $\rm PDF$ values are equal $0.2$ in the range $-2 < y < +3$. At the edges $f_Y(-2) = f_Y(+3)= 0.1$ (half value) holds.
(2) Same setting as for $(1)$. What are the probabilities ${\rm Pr}(X = 0)$, ${\rm Pr}(0.5 \le X \le 1.5)$, ${\rm Pr}(Y = 0)$ and ${\rm Pr}(0.5 \le Y \le 1.5)$ .
- ${\rm Pr}(X = 0)={\rm Pr}(Y = 0) \equiv 0$ ⇒ Probability of a discrete random variable to take exactly a certain value.
- The other two probabilities can be obtained by integration over the PDF in the range $+0.5\ \text{...} \ +\hspace{-0.1cm}1.5$.
- Or: ${\rm Pr}(0.5 \le X \le 1.5)= F_X(1.5) - F_X(0.5) = 0.8944-0.1056 = 0.7888$. Correspondingly: ${\rm Pr}(0.5 \le Y \le 1.5)= 0.7-0.5=0.2$.
(3) Same settings as before. How must the standard deviation $\sigma_X$ be changed so that with the same mean $m_X$ it holds for the quadratic mean: $P_X=2$ ?
- According to Steiner's theorem: $P_X=m_X^2 + \sigma_X^2$ ⇒ $\sigma_X^2 = P_X-m_X^2 = 2 - 1^2 = 1 $ ⇒ $\sigma_X = 1$.
(4) Same settings as before: How must the parameters $y_{\rm min}$ and $y_{\rm max}$ of the rectangular PDF be changed to yield $m_Y = 0$ and $\sigma_Y^2 = 0.75$?
- Starting from the previous setting $(y_{\rm min} = -2, \ y_{\rm max} = +3)$ we change $y_{\rm max}$ until $\sigma_Y^2 = 0.75$ occurs ⇒ $y_{\rm max} = 1$.
- The width of the rectangle is now $3$. The desired mean $m_Y = 0$ is obtained by shifting: $y_{\rm min} = -1.5, \ y_{\rm max} = +1.5$.
- You could also consider that for a mean-free random variable $(y_{\rm min} = -y_{\rm max})$ the following equation holds: $\sigma_Y^2 = y_{\rm max}^2/3$.
(5) For which of the adjustable distributions is the Charlier skewness $S \ne 0$ ?
- The Charlier's skewness denotes the third central moment related to $σ_X^3$ ⇒ $S_X = \mu_3/σ_X^3$ $($valid for the random variable $X)$.
- If the PDF $f_X(x)$ is symmetric around the mean $m_X$ then the parameter $S_X$ is always zero.
- Exponential distribution: $S_X =2$; Rayleigh distribution: $S_X =0.631$ $($both independent of $λ_X)$; Rice distribution: $S_X >0$ $($dependent of $C_X, \ λ_X)$.
- With the Weibull distribution, the Charlier skewness $S_X$ can be zero, positive or negative, depending on the PDF parameter $k_X$.
- Weibull distribution, $\lambda_X=0.4$: With $k_X = 1.5$ ⇒ PDF is curved to the left $(S_X > 0)$; $k_X = 7$ ⇒ PDF is curved to the right $(S_X < 0)$.
(6) Select $\text{Red: Gaussian PDF}\ (m_X = 1, \ \sigma_X = 0.4)$ and $\text{Blue: Gaussian PDF}\ (m_X = 0, \ \sigma_X = 1)$. What is the kurtosis in each case?
- For each Gaussian distribution the kurtosis has the same value: $K_X = K_Y =3$. Therefore, $K-3$ is called "excess".
- This parameter can be used to check whether a given random variable can be approximated by a Gaussian distribution.
(7) For which distributions does a significantly smaller kurtosis value result than $K=3$? And for which distributions does a significantly larger one?
- $K<3$ always results when the PDF values are more concentrated around the mean than in the Gaussian distribution.
- This is true, for example, for the uniform distribution $(K=1.8)$ and for the triangular distribution $(K=2.4)$.
- $K>3$, if the PDF offshoots are more pronounced than for the Gaussian distribution. Example: Exponential PDF $(K=9)$.
(8) Select $\text{Red: Exponential PDF}\ (\lambda_X = 1)$ and $\text{Blue: Laplace PDF}\ (\lambda_Y = 1)$. Interpret the differences.
- The Laplace distribution is symmetric around its mean $(S_Y=0, \ m_Y=0)$ unlike the exponential distribution $(S_X=2, \ m_X=1)$.
- The even moments $m_2, \ m_4, \ \text{...}$ are equal, for example: $P_X=P_Y=2$. But not the variances: $\sigma_X^2 =1, \ \sigma_Y^2 =2$.
- The probabilities ${\rm Pr}(|X| < 2) = F_X(2) = 0.864$ and ${\rm Pr}(|Y| < 2) = F_Y(2) - F_Y(-2)= 0.932 - 0.068 = 0.864$ are equal.
- In the Laplace PDF, the values are more tightly concentrated around the mean than in the exponential PDF: $K_Y =6 < K_X = 9$.
(9) Select $\text{Red: Rice PDF}\ (\lambda_X = 1, \ C_X = 1)$ and $\text{Blue: Rayleigh PDF}\ (\lambda_Y = 1)$. Interpret the differences.
- With $C_X = 0$ the Rice PDF transitions to the Rayleigh PDF. A larger $C_X$ improves the performance, e.g., in mobile communications.
- Both, in "Rayleigh" and "Rice" the abscissa is the magnitude $A$ of the received signal. Favorably, if ${\rm Pr}(A \le A_0)$ is small $(A_0$ given$)$.
- For $C_X \ne 0$ and equal $\lambda$ the Rice CDF is below the Rayleigh CDF ⇒ smaller ${\rm Pr}(A \le A_0)$ for all $A_0$.
(10) Select $\text{Red: Rice PDF}\ (\lambda_X = 0.6, \ C_X = 2)$. By which distribution $F_Y(y)$ can this Rice distribution be well approximated?
- The kurtosis $K_X = 2.9539 \approx 3$ indicates the Gaussian distribution. Favorable parameters: $m_Y = 2.1 > C_X, \ \ \sigma_Y = \lambda_X = 0.6$.
- The larger tht quotient $C_X/\lambda_X$ is, the better the Rice PDF is approximated by a Gaussian PDF.
- For large $C_X/\lambda_X$ the Rice PDF has no more similarity with the Rayleigh PDF.
(11) Select $\text{Red: Weibull PDF}\ (\lambda_X = 1, \ k_X = 1)$ and $\text{Blue: Weibull PDF}\ (\lambda_Y = 1, \ k_Y = 2)$. Interpret the results.
- The Weibull PDF $f_X(x)$ is identical to the exponential PDF and $f_Y(y)$ to the Rayleigh PDF.
- However, after best fit, the parameters $\lambda_{\rm Weibull} = 1$ and $\lambda_{\rm Rayleigh} = 0.7$ differ.
- Moreover, it holds $f_X(x = 0) \to \infty$ for $k_X < 1$. However, this does not have the affect of infinite momenta.
(12) Select $\text{Red: Weibull PDF}\ (\lambda_X = 1, \ k_X = 1.6)$ and $\text{Blue: Weibull PDF}\ (\lambda_Y = 1, \ k_Y = 5.6)$. Interpret the Charlier skewness.
- One observes: For the PDF parameter $k < k_*$ the Charlier skewness is positive and for $k > k_*$ negative. It is approximately $k_* = 3.6$.
(13) Select $\text{Red: Semicircle PDF}\ (m_X = 0, \ R_X = 1)$ and $\text{Blue: Parabolic PDF}\ (m_Y = 0, \ R_Y = 1)$. Vary the parameter $R$ in each case.
- The PDF in each case is mean-free and symmetric $(S_X = S_Y =0)$ with $\sigma_X^2 = 0.25, \ K_X = 2$ respectively, $\sigma_Y^2 = 0.2, \ K_Y \approx 2.2$.
Applet Manual
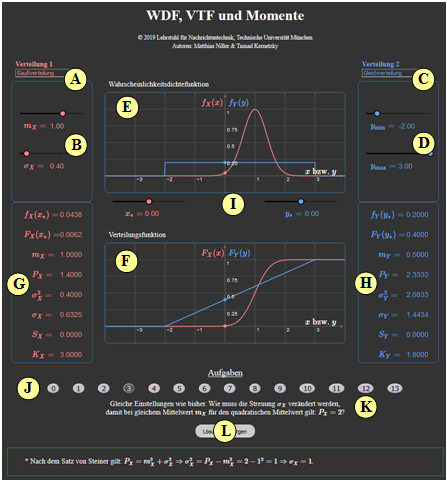
(A) Auswahl der Verteilung $f_X(x)$ (rote Kurven und Ausgabewerte)
(B) Parametereingabe für die "rote Verteilung" per Slider
(C) Auswahl der Verteilung $f_Y(y)$ (blaue Kurven und Ausgabewerte)
(D) Parametereingabe für die "rote Verteilung" per Slider
(E) Grafikbereich für die Wahrscheinlichkeitsdichtefunktion (WDF)
(F) Grafikbereich für die Verteilungsfunktion (VTF)
(G) Numerikausgabe für die "rote Verteilung"
(H) Numerikausgabe für die "blaue Verteilung"
( I ) Eingabe der Abszissenwerte $x_*$ und $y_*$ für die Numerik–Ausgaben
(J) Bereich für die Versuchsdurchführung: Aufgabenauswahl
(K) Bereich für die Versuchsdurchführung: Aufgabenstellung
( L) Bereich für die Versuchsdurchführung: Musterlösung
Auswahlmöglichkeiten für $\rm A$ und $\rm C$:
Gaußverteilung, Gleichverteilung, Dreieckverteilung, Exponentialverteilung, Laplaceverteilung, Rayleighverteilung, Riceverteilung, Weibullverteilung, Wigner–Halbkreisverteilung, Wigner–Parabelverteilung, Cauchyverteilung.
Folgende »integrale Kenngrößen« werden ausgegeben $($bzgl. $X)$:
Linearer Mittelwert $m_X = {\rm E}\big[X \big]$, quadratischer Mittelwert $P_X ={\rm E}\big[X^2 \big] $, Varianz $\sigma_X^2 = P_X - m_X^2$, Standardabweichung (oder Streuung) $\sigma_X$, Charliersche Schiefe $S_X$, Kurtosis $K_X$.
In all applets top right: Changeable graphical interface design ⇒ Theme:
- Dark: black background (recommended by the authors).
- Bright: white background (recommended for beamers and printouts)
- Deuteranopia: for users with pronounced green–visual impairment
- Protanopia: for users with pronounced red–visual impairment
About the Authors
This interactive calculation tool was designed and implemented at the $\text{Institute for Communications Engineering}$ at the $\text{Technical University of Munich}$.
- The first version was created in 2005 by $\text{Bettina Hirner}$ as part of her diploma thesis with “FlashMX – Actionscript” (Supervisor: $\text{Günter Söder}$ and $\text{Klaus Eichin}$).
- In 2019 the program was redesigned via HTML5/JavaScript by $\text{Matthias Niller}$ (Ingenieurspraxis Mathematik, Supervisor: $\text{Benedikt Leible}$ and $\text{Tasnád Kernetzky}$ ).
- Last revision and English version 2021 by $\text{Carolin Mirschina}$ in the context of a working student activity. Translation using DEEPL.com (free version).
- The conversion of this applet was financially supported by $\text{Studienzuschüsse}$ (TUM Department of Electrical and Computer Engineering). We thank.
