[[File:P_ID2062__Dig_A_4_12.png|right|frame|Signal space constellation of 16–QAM]]
[[File:P_ID2062__Dig_A_4_12.png|right|frame|Signal space constellation of $\rm 16–QAM$]]
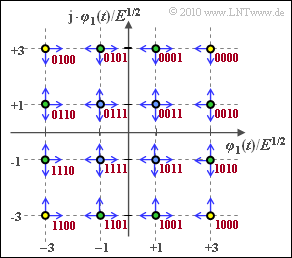
The graphic shows the signal space constellation of the [[Digital_Signal_Transmission/Carrier_Frequency_Systems_with_Coherent_Demodulation#Quadrature_amplitude_modulation_.28M-QAM.29|"quadrature amplitude modulation"]] with $M = 16$ signal space points.
The graph shows the signal space constellation of [[Digital_Signal_Transmission/Carrier_Frequency_Systems_with_Coherent_Demodulation#Quadrature_amplitude_modulation_.28M-QAM.29|"quadrature amplitude modulation"]] with $M = 16$ signal space points. The following should be calculated for this modulation method:
* the average energy per symbol or per bit,
* the average symbol error probability $p_{\rm S}$,
The following should be calculated for this modulation method:
* the average energy per symbol or per bit,
* the mean symbol error probability $p_{\rm S}$,
*the [[Digital_Signal_Transmission/Approximation_of_the_Error_Probability#Union_Bound_-_Upper_bound_for_the_error_probability|"Union Bound"]] $p_{\rm UB}$ as upper bound,
*the [[Digital_Signal_Transmission/Approximation_of_the_Error_Probability#Union_Bound_-_Upper_bound_for_the_error_probability|"Union Bound"]] $p_{\rm UB}$ as upper bound,
* the average bit error probability $p_{\rm B}$ with Gray coding.
* the average bit error probability $p_{\rm B}$ with Gray coding.
Notes:
# The exercise deals with a partial aspect of the chapter [[Digital_Signal_Transmission/Carrier_Frequency_Systems_with_Coherent_Demodulation|"Carrier Frequency Systems with Coherent Demodulation"]].
''Notes:''
#The Gray assignment is given in the graphic $($red lettering$)$.
* The exercise deals with a partial aspect of the chapter [[Digital_Signal_Transmission/Carrier_Frequency_Systems_with_Coherent_Demodulation|"Carrier Frequency Systems with Coherent Demodulation]].
#The probability that the upper left symbol is falsified into one of the neighboring symbols is abbreviated to $p$ $($blue arrows in the graph$)$.
*The Gray assignment is given in the graphic (red lettering).
#A diagonal falsification ⇒ two bit falsified $($green arrow$)$ is excluded.
* The probability that the upper left symbol is falsified into one of the neighboring symbols is abbreviated to $p$ (blue arrows in the graph).
#For the AWGN channel, with the complementary Gaussian error integral for this auxiliary variable, the following applies: $p = {\rm Q} \left ( \sqrt{ { 2E}/{ N_0} }\right )\hspace{0.05cm}.$
* A diagonal falsification ⇒ two bit falsified (green arrow) is excluded.
# For numerical calculations, use $E = 1 \ \rm mWs$ and $p = 0.4\%$.
* For the AWGN channel, with the complementary Gaussian error integral for this auxiliary variable, the following applies: $p = {\rm Q} \left ( \sqrt{ { 2E}/{ N_0} }\right )\hspace{0.05cm}.$
#The AWGN noise power density $N_0$ can be calculated approximately from these values:
* For numerical calculations, use $E = 1 \ \rm mWs$ and $p = 0.4\%$.
{Calculate the actual bit error rate for Gray coding.
{Calculate the actual bit error probability $p_{\rm B}$ for Gray coding.
|type="{}"}
|type="{}"}
$p_{\rm B} \ = \ $ { 0.3 3% } $\ \%$
$p_{\rm B} \ = \ $ { 0.3 3% } $\ \%$
Line 55:
Line 52:
===Solution===
===Solution===
{{ML-Kopf}}
{{ML-Kopf}}
'''(1)''' The quotient $E_{\rm S}/E$ is obtained as the mean square distance of the $M = 16$ signal space points $\boldsymbol{s}_i$ from the origin.
'''(1)''' The quotient $E_{\rm S}/E$ is obtained as the mean square distance of the $M = 16$ signal space points $\boldsymbol{s}_i$ from the origin.
*With the given signal space constellation of the 16–QAM we obtain:
*The same result is obtained with the equation given in the [[Digital_Signal_Transmission/Carrier_Frequency_Systems_with_Coherent_Demodulation| "theory section"]]
*With the given signal space constellation of the $\rm 16–QAM$ we obtain:
:$$E_{\rm S} = \frac{ 2 \cdot (M-1)}{ 3 } \cdot E = \frac{ 2 \cdot 15}{ 3 } \cdot E = 10 E
*The same result is obtained with the equation given in the [[Digital_Signal_Transmission/Carrier_Frequency_Systems_with_Coherent_Demodulation| "theory section"]]:
'''(3)''' The "Union Bound" is an upper bound on the symbol error probability.
*It only takes into account the transition to adjacent decision regions due to AWGN noise.
*It only takes into account the transition to adjacent decision regions due to AWGN noise.
*From the graph, it can be seen that the corner symbols (filled in yellow) can only be biased towards two other symbols and the remaining edge symbols (filled in green) can be biased in three directions.
*The "worst case" are the four inner symbols (with blue filling) with four falsification possibilities each. From this follows:
*From the graph, it can be seen that the corner symbols (filled in yellow) can only be biased towards two other symbols and the remaining edge symbols (filled in green) can be biased in three directions.
'''(4)''' Counting the blue arrows in the above graph, we get
*The "worst case" are the four inner symbols (with blue filling) with four falsification possibilities each.
*The same result is obtained with the equation given in the [[Digital_Signal_Transmission/Carrier_Frequency_Systems_with_Coherent_Demodulation| "theory section"]]
*The same result is obtained with the equation given in the [[Digital_Signal_Transmission/Carrier_Frequency_Systems_with_Coherent_Demodulation| "theory section"]]:
The graph shows the signal space constellation of "quadrature amplitude modulation" with $M = 16$ signal space points. The following should be calculated for this modulation method:
The Gray assignment is given in the graphic $($red lettering$)$.
The probability that the upper left symbol is falsified into one of the neighboring symbols is abbreviated to $p$ $($blue arrows in the graph$)$.
A diagonal falsification ⇒ two bit falsified $($green arrow$)$ is excluded.
For the AWGN channel, with the complementary Gaussian error integral for this auxiliary variable, the following applies: $p = {\rm Q} \left ( \sqrt{ { 2E}/{ N_0} }\right )\hspace{0.05cm}.$
For numerical calculations, use $E = 1 \ \rm mWs$ and $p = 0.4\%$.
The AWGN noise power density $N_0$ can be calculated approximately from these values:
(3) The "Union Bound" is an upper bound on the symbol error probability.
It only takes into account the transition to adjacent decision regions due to AWGN noise.
From the graph, it can be seen that the corner symbols (filled in yellow) can only be biased towards two other symbols and the remaining edge symbols (filled in green) can be biased in three directions.
The "worst case" are the four inner symbols (with blue filling) with four falsification possibilities each.