Difference between revisions of "Aufgaben:Exercise 5.1: Gaussian ACF and Gaussian Low-Pass"
m (Text replacement - "rms value" to "standard deviation") |
|||
| Line 33: | Line 33: | ||
<quiz display=simple> | <quiz display=simple> | ||
| − | {What is the | + | {What is the standard deviation of the filter input signal? |
|type="{}"} | |type="{}"} | ||
$\sigma_x \ = \ $ { 0.2 3% } $\ \rm V$ | $\sigma_x \ = \ $ { 0.2 3% } $\ \rm V$ | ||
Latest revision as of 12:11, 17 February 2022
At the input of a low-pass filter with frequency response $H(f)$, there is a Gaussian distributed mean-free noise signal $x(t)$ with the following auto-correlation function $\rm (ACF)$:
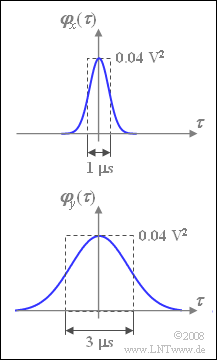
- $${\it \varphi}_{x}(\tau) = \sigma_x^2 \cdot {\rm e}^{- \pi (\tau /{\rm \nabla} \tau_x)^2}.$$
This ACF is shown in the accompanying diagram above.
Let the filter be Gaussian with the DC gain $H_0$ and the equivalent bandwidth $\Delta f$. Thus, for the frequency response, it can be written:
- $$H(f) = H_{\rm 0} \cdot{\rm e}^{- \pi (f/ {\rm \Delta} f)^2}.$$
In the course of this task, the two filter parameters $H_0$ and $\Delta f$ are to be dimensioned so that the output signal $y(t)$ has an ACF corresponding to the diagram below.
Notes:
- The exercise belongs to the chapter Stochastic System Theory.
- Reference is also made to the chapter Auto-Correlation Function.
- Consider the following Fourier correspondence:
- $${\rm e}^{- \pi (f/{\rm \Delta} f)^2} \hspace{0.15cm} \bullet\!\!-\!\!\!-\!\!\!\hspace{0.03cm}\circ \hspace{0.15cm}{\rm \Delta} f \cdot {\rm e}^{- \pi ({\rm \Delta} f \hspace{0.03cm} \cdot \hspace{0.03cm} t)^2}.$$
Questions
Solution
- From this follows $\sigma_x\hspace{0.15cm}\underline {= 0.2 \ \rm V}$.
(2) The equivalent ACF duration can be determined via the rectangle of equal area.
- According to the sketch, we obtain $\nabla \tau_x\hspace{0.15cm}\underline {= 1 \ \rm µ s}$.
(3) The PSD is the Fourier transform of the ACF.
- With the given Fourier correspondence holds:
- $${\it \Phi}_{x}(f) = \sigma_x^2 \cdot {\rm \nabla} \tau_x \cdot {\rm e}^{- \pi ({\rm \nabla} \tau_x \hspace{0.03cm}\cdot \hspace{0.03cm}f)^2} .$$
- At frequency $f = 0$, we obtain:
- $${\it \Phi}_{x}(f = 0) = \sigma_x^2 \cdot {\rm \nabla} \tau_x = \rm 0.04 \hspace{0.1cm} V^2 \cdot 10^{-6} \hspace{0.1cm} s \hspace{0.15cm} \underline{= 40 \cdot 10^{-9} \hspace{0.1cm} V^2 / Hz}.$$
(4) Solutions 1 and 3 are correct:
- In general, ${\it \Phi}_{y}(f) = {\it \Phi}_{x}(f) \cdot |H(f)|^2$. It follows:
- $${\it \Phi}_{y}(f) = \sigma_x^2 \cdot {\rm \nabla} \tau_x \cdot {\rm e}^{- \pi ({\rm \nabla} \tau_x \cdot f)^2}\cdot H_{\rm 0}^2 \cdot{\rm e}^{- 2 \pi (f/ {\rm \Delta} f)^2} .$$
- By combining the two exponential functions, we obtain:
- $${\it \Phi}_{y}(f) = \sigma_x^2 \cdot {\rm \nabla} \tau_x \cdot H_0^2 \cdot {\rm e}^{- \pi\cdot ({\rm \nabla} \tau_x^2 + 2/\Delta f^2 ) \hspace{0.1cm}\cdot f^2}.$$
- Also ${\it \Phi}_{y}(f)$ is Gaussian and never wider than ${\it \Phi}_{x}(f)$. For $f \to \infty$, the approximation ${\it \Phi}_{y}(f) \approx {\it \Phi}_{x}(f)$ holds.
- As $\Delta f$ gets smaller, ${\it \Phi}_{y}(f)$ gets narrower (so the second statement is false).
- $H_0$ actually affects only the PSD height, but not the width of the PSD.
(5) Analogous to task (1), it can be written for the PSD of the output signal $y(t)$:
- $${\it \Phi}_{y}(f) = \sigma_y^2 \cdot {\rm \nabla} \tau_y \cdot {\rm e}^{- \pi \cdot {\rm \nabla} \tau_y^2 \cdot f^2 }.$$
- By comparing with the result from (4) we get:
- $${{\rm \nabla} \tau_y^2} = {{\rm \nabla} \tau_x^2} + \frac {2}{{\rm \Delta} f^2}.$$
- Solving the equation for $\Delta f$ and considering the values $\nabla \tau_x {= 1 \ \rm µ s}$ as well as $\nabla \tau_y {= 3 \ \rm µ s}$, it follows:
- $${\rm \Delta} f = \sqrt{\frac{2}{{\rm \nabla} \tau_y^2 - {\rm \nabla} \tau_x^2}} = \sqrt{\frac{2}{9 - 1}} \hspace{0.1cm}\rm MHz \hspace{0.15cm} \underline{= 0.5\hspace{0.1cm} MHz} .$$
(6) The condition $\sigma_y = \sigma_x$ is equivalent to $\varphi_y(\tau = 0)= \varphi_x(\tau = 0)$.
- Moreover, since $\nabla \tau_y = 3 \cdot \nabla \tau_x$ is given, therefore ${\it \Phi}_{y}(f= 0) = 3 \cdot {\it \Phi}_{x}(f= 0)$ must also hold.
- From this we obtain:
- $$H_{\rm 0} = \sqrt{\frac{\it \Phi_y (f \rm = 0)}{\it \Phi_x (f = \rm 0)}} = \sqrt {3}\hspace{0.15cm} \underline{=1.732}.$$
