Difference between revisions of "Aufgaben:Exercise 3.10: Maximum Likelihood Tree Diagram"
| Line 1: | Line 1: | ||
| − | {{quiz-Header|Buchseite= | + | {{quiz-Header|Buchseite=Digital_Signal_Transmission/Optimal_Receiver_Strategies}} |
| − | [[File:P_ID1465__Dig_A_3_10_95.png|right|frame| | + | [[File:P_ID1465__Dig_A_3_10_95.png|right|frame|Signals and tree diagram]] |
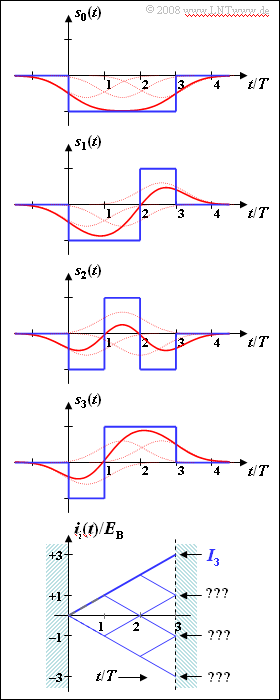
| − | + | As in [[Aufgaben:Exercise_3.09:_Correlation_Receiver_for_Unipolar_Signaling|"Exercise 3.9"]] we consider the joint decision of three binary symbols (bits) by means of the correlation receiver. | |
| − | * | + | *The possible transmitted signals $s_0(t), \ \text{...} \ , \ s_7(t)$ are bipolar. |
| − | *In | + | *In the graphic the functions $s_0(t)$, $s_1(t)$, $s_2(t)$ and $s_3(t)$ are shown. |
| − | * | + | *The blue curves are valid for rectangular NRZ transmission pulses. |
| − | + | Below is drawn the so-called tree diagram for this constellation under the condition that the signal $s_3(t)$ was transmitted. Shown here in the range from $0$ to $3T$ are the functions | |
:$$i_i(t) = \int_{0}^{t} s_3(\tau) \cdot s_i(\tau) \,{\rm d} | :$$i_i(t) = \int_{0}^{t} s_3(\tau) \cdot s_i(\tau) \,{\rm d} | ||
\tau \hspace{0.3cm}( i = 0, \ \text{...} \ , 7)\hspace{0.05cm}.$$ | \tau \hspace{0.3cm}( i = 0, \ \text{...} \ , 7)\hspace{0.05cm}.$$ | ||
| − | * | + | *The correlation receiver compares the final values $I_i = i_i(3T)$ with each other and searches for the largest possible value $I_j$. |
| − | * | + | *The corresponding signal $s_j(t)$ is then the one most likely to have been sent according to the maximum likelihood criterion. |
| − | + | Note that the correlation receiver generally makes the decision based on the corrected quantities $W_i = I_i \ - E_i/2$. But since for bipolar rectangles all transmitted signals $(i = 0, \ \text{...} \ , \ 7)$ have exactly the same energy | |
:$$E_i = \int_{0}^{3T} s_i^2(t) \,{\rm d} t$$ | :$$E_i = \int_{0}^{3T} s_i^2(t) \,{\rm d} t$$ | ||
| − | + | the integrals $I_i$ provide exactly the same maximum likelihood information as the corrected quantities $W_i$. | |
| − | + | The red signal waveforms $s_i(t)$ are obtained from the blue ones by convolution with the impulse response $h_{\rm G}(t)$ of a Gaussian low-pass filter with cutoff frequency $f_{\rm G} \cdot T = 0.35$. | |
| − | * | + | *Each individual rectangular pulse is broadened. |
| − | * | + | *The red signal waveforms lead to intersymbol interference in case of threshold decision. |
| Line 31: | Line 31: | ||
| − | '' | + | ''Note:'' |
| − | * | + | *The exercise belongs to the chapter [[Digital_Signal_Transmission/Optimal_Receiver_Strategies|"Optimal Receiver Strategies"]]. |
| − | === | + | ===Questions=== |
<quiz display=simple> | <quiz display=simple> | ||
| − | { | + | {Give the following normalized final values $I_i/E_{\rm B}$ for rectangular signals (without noise). |
|type="{}"} | |type="{}"} | ||
$I_0/E_{\rm B} \ = \ $ { -1.03--0.97 } | $I_0/E_{\rm B} \ = \ $ { -1.03--0.97 } | ||
| Line 46: | Line 46: | ||
$I_6/E_{\rm B} \ = \ $ { -1.03--0.97 } | $I_6/E_{\rm B} \ = \ $ { -1.03--0.97 } | ||
| − | { | + | {Which statements are valid when considering a noise term? |
|type="[]"} | |type="[]"} | ||
| − | - | + | - The tree diagram can be further described by straight line segments. |
| − | + | + | + If $I_3$ is the maximum $I_i$ value, the receiver decides correctly. |
| − | - | + | - $I_0 = I_6$ is valid independent of the strength of the noise. |
| − | { | + | {Which statements are valid for the red signal waveforms (with intersymbol interference)? |
|type="[]"} | |type="[]"} | ||
| − | - | + | - The tree diagram can be further described by straight line segments. |
| − | + | + | + The signal energies $E_i(i = 0, \ \text{...} \ , 7$) are different. |
| − | - | + | - Both the decision variables $I_i$ and $W_i$ are suitable. |
| − | { | + | {How should the intergration range $(t_1 \ \text{...} \ t_2)$ be chosen? |
|type="[]"} | |type="[]"} | ||
| − | + | + | + Without intersymbol interference (blue), $t_1 = 0$ and $t_2 = 3T$ are best possible. |
| − | - | + | - With intersymbol interference (red), $t_1 = 0$ and $t_2 = 3T$ are best possible. |
</quiz> | </quiz> | ||
| − | === | + | ===Solution=== |
{{ML-Kopf}} | {{ML-Kopf}} | ||
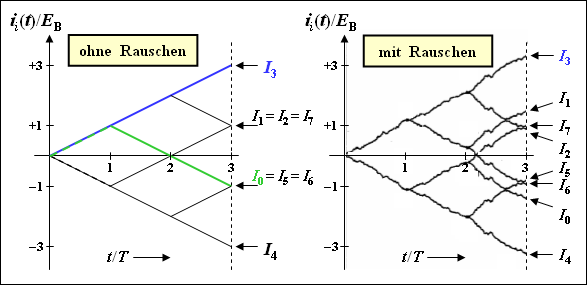
| − | '''(1)''' | + | '''(1)''' The left graph shows the tree diagram (without noise) with all final values. Highlighted in green is the curve $i_0(t)/E_{\rm B}$ with the final result $I_0/E_{\rm B} = \ –1$, which first rises linearly to $+1$ – the first bit of $s_0(t)$ and $s_3(t)$ in each case coincide – and then falls off over two bit durations. |
| − | [[File:P_ID1466__Dig_A_3_10.png|right|frame| | + | [[File:P_ID1466__Dig_A_3_10.png|right|frame|Tree diagram of the correlation receiver]] |
| − | + | The correct results are thus: | |
:$$I_0/E_{\rm B}\hspace{0.15cm}\underline { = -1},$$ | :$$I_0/E_{\rm B}\hspace{0.15cm}\underline { = -1},$$ | ||
:$$I_2/E_{\rm B} \hspace{0.15cm}\underline {= +1}, $$ | :$$I_2/E_{\rm B} \hspace{0.15cm}\underline {= +1}, $$ | ||
| Line 75: | Line 75: | ||
\hspace{0.05cm}.$$ | \hspace{0.05cm}.$$ | ||
<br clear=all> | <br clear=all> | ||
| − | '''(2)''' | + | '''(2)''' Only the <u>second solution</u> is correct: |
| − | * | + | *In the presence of (noise) disturbances, the functions $i_i(t)$ no longer increase or decrease linearly, but have a curve as shown in the right graph. |
| − | * | + | *As long as $I_3 > I_{\it i≠3}$, the correlation receiver decides correctly. |
| − | * | + | *In the presence of noise, $I_0 ≠ I_6$ always holds, in contrast to the noise-free tree diagram. |
| − | '''(3)''' | + | '''(3)''' Only the <u>second statement</u> is true: |
| − | * | + | *Since now the possible transmitted signals $s_i(t)$ can no longer be composed of isolated horizontal sections, also the tree diagram without noise does not consist of straight line segments. |
| − | * | + | *Since the energies $E_i$ are different – this can be seen, for example, by comparing the (red) signals $s_0(t)$ and $s_2(t)$ – it is essential to use the corrected quantities $W_i$ for the decision. |
| − | * | + | *The use of the pure correlation values $I_i$ can already lead to wrong decisions without noise disturbances. |
| − | '''(4)''' | + | '''(4)''' <u>Answer 1</u> is correct: |
| − | * | + | *In the case <u>without intersymbol interference</u> (blue rectangular signals), all signals are limited to the range $0 \ ... \ 3T$. |
| − | * | + | *Outside this range the received signal $r(t)$ is pure noise. |
| − | * | + | *Therefore in this case also the integration over the range $0 \ \text{...} \ 3T$. |
| − | * | + | *In contrast, when intersymbol interference (red signals) is taken into account, the integrands $s_3(t) \cdot s_i(t)$ also differ outside this range. |
| − | * | + | *Therefore, if $t_1 = \ –T$ and $t_2 = +4T$ are chosen, the error probability of the correlation receiver is further reduced compared to the integration range $0 \ \text{...} \ 3T$ is further reduced. |
{{ML-Fuß}} | {{ML-Fuß}} | ||
Revision as of 12:32, 31 May 2022
As in "Exercise 3.9" we consider the joint decision of three binary symbols (bits) by means of the correlation receiver.
- The possible transmitted signals $s_0(t), \ \text{...} \ , \ s_7(t)$ are bipolar.
- In the graphic the functions $s_0(t)$, $s_1(t)$, $s_2(t)$ and $s_3(t)$ are shown.
- The blue curves are valid for rectangular NRZ transmission pulses.
Below is drawn the so-called tree diagram for this constellation under the condition that the signal $s_3(t)$ was transmitted. Shown here in the range from $0$ to $3T$ are the functions
- $$i_i(t) = \int_{0}^{t} s_3(\tau) \cdot s_i(\tau) \,{\rm d} \tau \hspace{0.3cm}( i = 0, \ \text{...} \ , 7)\hspace{0.05cm}.$$
- The correlation receiver compares the final values $I_i = i_i(3T)$ with each other and searches for the largest possible value $I_j$.
- The corresponding signal $s_j(t)$ is then the one most likely to have been sent according to the maximum likelihood criterion.
Note that the correlation receiver generally makes the decision based on the corrected quantities $W_i = I_i \ - E_i/2$. But since for bipolar rectangles all transmitted signals $(i = 0, \ \text{...} \ , \ 7)$ have exactly the same energy
- $$E_i = \int_{0}^{3T} s_i^2(t) \,{\rm d} t$$
the integrals $I_i$ provide exactly the same maximum likelihood information as the corrected quantities $W_i$.
The red signal waveforms $s_i(t)$ are obtained from the blue ones by convolution with the impulse response $h_{\rm G}(t)$ of a Gaussian low-pass filter with cutoff frequency $f_{\rm G} \cdot T = 0.35$.
- Each individual rectangular pulse is broadened.
- The red signal waveforms lead to intersymbol interference in case of threshold decision.
Note:
- The exercise belongs to the chapter "Optimal Receiver Strategies".
Questions
Solution
The correct results are thus:
- $$I_0/E_{\rm B}\hspace{0.15cm}\underline { = -1},$$
- $$I_2/E_{\rm B} \hspace{0.15cm}\underline {= +1}, $$
- $$I_4/E_{\rm B} \hspace{0.15cm}\underline {= -3}, $$
- $$I_6/E_{\rm B}\hspace{0.15cm}\underline { = -1} \hspace{0.05cm}.$$
(2) Only the second solution is correct:
- In the presence of (noise) disturbances, the functions $i_i(t)$ no longer increase or decrease linearly, but have a curve as shown in the right graph.
- As long as $I_3 > I_{\it i≠3}$, the correlation receiver decides correctly.
- In the presence of noise, $I_0 ≠ I_6$ always holds, in contrast to the noise-free tree diagram.
(3) Only the second statement is true:
- Since now the possible transmitted signals $s_i(t)$ can no longer be composed of isolated horizontal sections, also the tree diagram without noise does not consist of straight line segments.
- Since the energies $E_i$ are different – this can be seen, for example, by comparing the (red) signals $s_0(t)$ and $s_2(t)$ – it is essential to use the corrected quantities $W_i$ for the decision.
- The use of the pure correlation values $I_i$ can already lead to wrong decisions without noise disturbances.
(4) Answer 1 is correct:
- In the case without intersymbol interference (blue rectangular signals), all signals are limited to the range $0 \ ... \ 3T$.
- Outside this range the received signal $r(t)$ is pure noise.
- Therefore in this case also the integration over the range $0 \ \text{...} \ 3T$.
- In contrast, when intersymbol interference (red signals) is taken into account, the integrands $s_3(t) \cdot s_i(t)$ also differ outside this range.
- Therefore, if $t_1 = \ –T$ and $t_2 = +4T$ are chosen, the error probability of the correlation receiver is further reduced compared to the integration range $0 \ \text{...} \ 3T$ is further reduced.

