Difference between revisions of "Modulation Methods/General Model of Modulation"
m |
m |
||
| Line 67: | Line 67: | ||
| − | *In the''Frequency Shift Keying'' $\rm (FSK)$ signal waveform, the two possible signal values $q(t) = +1$ and $q(t) =-1$ are represented by two different frequencies, respectively. | + | *In the ''Frequency Shift Keying'' $\rm (FSK)$ signal waveform, the two possible signal values $q(t) = +1$ and $q(t) =-1$ are represented by two different frequencies, respectively. |
Revision as of 15:16, 11 November 2021
Contents
- 1 Joint description of amplitude and angle modulation
- 2 A very simple (though unfortunately not always correct) modulator equation
- 3 Modulated signals with a digital source signal
- 4 Describing the physical signal using the analytical signal
- 5 Beschreibung des physikalischen Signals mit Hilfe des äquivalenten TP-Signals
- 6 Aufgaben zum Kapitel
Joint description of amplitude and angle modulation
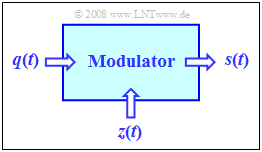
In the following two chapters Amplitude Modulation (AM) and Angle Modulation (WM – from German "Winkelmodulation", including PM as well as FM) we will always consider the set-up shown in the image on the right. Here, the central block is the Modulator.
The two input signals and the output signal have the following characteristics::
- The source signal $q(t)$ is the low frequency message signal and has the spectrum $Q(f)$. This signal is continuous in value and time and limited to the frequency range $|f| ≤ B_{\rm NF}$ (NF from German "Niederfrequenz" i.e. low frequency).
- The carrier signal $z(t)$ is a harmonic oscillation of the form
- $$z(t) = A_{\rm T} \cdot \cos(2 \pi f_{\rm T} t - \varphi_{\rm T})= A_{\rm T} \cdot \cos(2 \pi f_{\rm T} t + \phi_{\rm T})\hspace{0.05cm}.$$
- The transmission signal $s(t)$ is a higher frequency signal, whose spectral function $S(f)$ is in the range around the carrier frequency $f_{\rm T}$ .
The modulator output signal $s(t)$ depends on both input signals $q(t)$ and $z(t)$ . The modulation methods considered below differ only by different combinations of $q(t)$ and $z(t)$.
$\text{Definition:}$ Each Harmonic Oscillation $z(t)$ can be described by
- the amplitude $A_{\rm T}$,
- the frequency $f_{\rm T}$ and
- the zero phase position ${\it ϕ}_{\rm T}$ .
Though the above left equation with a minus sign and $φ_{\rm T}$ is mostly used for the application of Fourier series and Fourier integrals, the right equation with ${\it ϕ}_{\rm T} = \ – φ_{\rm T}$ and a plus sign is more common for the description of modulation processes.
A very simple (though unfortunately not always correct) modulator equation
$\text{Definition:}$ starting from the harmonic oscillation (here written with the angular frequency $ω_{\rm T} = 2πf_{\rm T}$ )
- $$z(t) = A_{\rm T} \cdot \cos(\omega_{\rm T}\cdot t + \phi_{\rm T})$$
we arrive at the general modulator equation, by assuming the previously fixed oscillation parameters to be time-dependent:
- $$s(t) = a(t) \cdot \cos \big[\omega(t) \cdot t + \phi(t)\big ]\hspace{0.05cm}.$$
$\text{!! Attention !!}$ This general modulator equation is very simple and striking and aids in understanding modulation methods. Unfortunately, this equation is true for frequency modulation only in exceptional cases. This will be discussed further in the chapter Signal characteristics in frequency modulation .
Special cases included in this equation are:
- In amplitude modulation $\rm (AM)$, the time-dependent amplitude $a(t)$ changes according to the source signal $q(t)$, while the other two signal parameters stay constant:
- $$\omega(t) = \omega_{\rm T} = {\rm const.}\hspace{0.08cm}, \hspace{0.2cm}\phi(t) = \phi_{\rm T} = {\rm const.}\hspace{0.08cm}, \hspace{0.2cm} a(t) = {\rm function \hspace{0.15cm}of}\hspace{0.15cm}q(t) .$$
- In frequency modulation $\rm (FM)$, only the instantaneous (circular) frequency $\omega(t)$ is determined by the source signal $q(t)$ :
- $$a(t) = A_{\rm T} = {\rm const.}\hspace{0.08cm}, \hspace{0.2cm}\phi(t) = \phi_{\rm T} = {\rm const.}\hspace{0.08cm}, \hspace{0.2cm} \omega(t)= {\rm function \hspace{0.15cm}of}\hspace{0.15cm}q(t) .$$
- In phase modulation $\rm (PM)$, the phase $\phi(t)$ varies according to the source signal $q(t)$:
- $$a(t) = A_{\rm T} = {\rm const.}\hspace{0.08cm}, \hspace{0.2cm}\omega(t) = \omega_{\rm T} = {\rm const.}\hspace{0.08cm}, \hspace{0.2cm} \phi(t) = {\rm function \hspace{0.15cm}of}\hspace{0.15cm}q(t) .$$
In these basic methods, two of the three oscillation parameters are thus always kept constant.
- Additionally, there are also variants with more than one time dependency for amplitude, frequency, and phase, respectively.
- An example of this is Single-Sideband Modulation, where both $a(t)$ and ${\it ϕ}(t)$ are affected by the source signal $q(t)$ .
Modulated signals with a digital source signal
When describing $\rm AM$, $\rm FM$ and $\rm PM$, the source signal $q(t)$ is usually assumed to be continuous in time and value.
- However, the above equations can also be applied to a rectangular source signal.
- In this case, $q(t)$ is continuous in time but discrete in value. Thus, it also describes methods for Linear Digital Modulation .
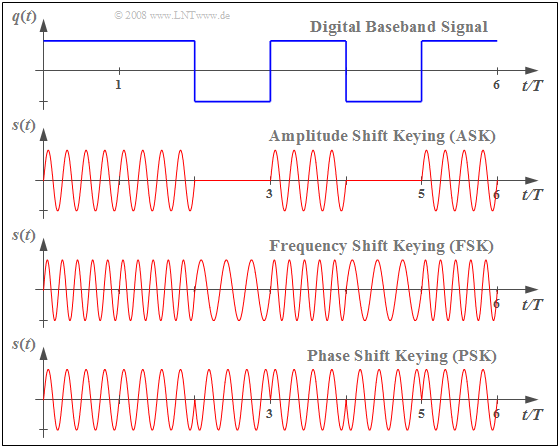
$\text{Example 1:}$ The graph shows a rectangular source signal $q(t)$ ⇒ Baseband signal, at the top, and the modulated signals $s(t)$ which result from important digital modulation methods drawn underneath.
- In amplitude modulation, the digital variant of which is known as Amplitude Shift Keying $\rm (ASK)$ , the message signal can be seen in the $s(t)$ envelope.
- In the Frequency Shift Keying $\rm (FSK)$ signal waveform, the two possible signal values $q(t) = +1$ and $q(t) =-1$ are represented by two different frequencies, respectively.
- Phase Shift Keying $\rm (PSK)$ results in phase jumps in the signal $s(t)$ when the amplitude of the source signal $q(t)$ jumps, by $\pm π$ (or $\pm 180^\circ$) in each binary case.
Describing the physical signal using the analytical signal
The modulated signal $s(t)$ is bandpass. As already described in the book „Signal Representation”, a BP signal $s(t)$ is often characterized by its associated analytical signal $s_+(t)$ . It is important to note:
- The analytical signal $s_+(t)$ is obtained from the real physical signal $s(t)$, by adding to it, as an imaginary part, its Hilbert transform:
- $$s_+(t) = s(t) + {\rm j} \cdot {\rm H}\{ s(t)\}\hspace{0.05cm}.$$
- The analytical signal $s_+(t)$ is therefore always complex. The following simple relationship holds between the two time signals:
- $$s(t) = {\rm Re} \big[s_+(t)\big] \hspace{0.05cm}.$$
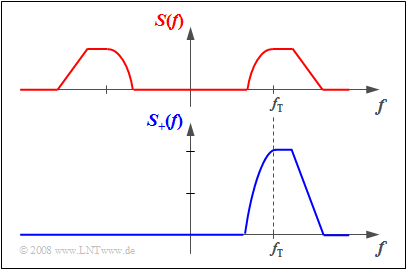
- The spectrum $S_+(f)$ of the analytic signal is obtained from the two-sided spectrum $S(f)$ by doubling it for positive frequencies and setting it to zero for negative frequencies:
- $$S_+(f) =\big[ 1 + {\rm sign}(f)\big] \cdot S(f) = \left\{ \begin{array}{c} 2 \cdot S(f) \\ 0 \\ \end{array} \right.\quad \begin{array}{*{10}c} {\rm{f\ddot{u}r}} \\ {\rm{f\ddot{u}r}} \\ \end{array}\begin{array}{*{20}c} f>0 \hspace{0.05cm}, \\ f<0 \hspace{0.05cm}, \\ \end{array} \hspace{1.3cm} \text{mit}\hspace{1.3cm} {\rm sign}(f) = \left\{ \begin{array}{c} +1 \\ -1 \\ \end{array} \right.\quad \begin{array}{*{10}c} {\rm{f\ddot{u}r}} \\ {\rm{f\ddot{u}r}} \\ \end{array}\begin{array}{*{20}c} f>0 \hspace{0.05cm}, \\ f<0 \hspace{0.05cm}. \\ \end{array}$$
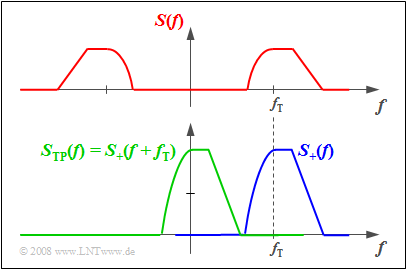
$\text{Beispiel 2:}$ The above graph shows the spectrum $S(f)$ of a real time signal $s(t)$. One can see:
- The axial symmetry of the spectral function $S(f)$ with respect to the frequency $f=0$:
- $${\rm Re}\big[S( - f)\big] = {\rm Re}\big[S(f)\big].$$
- If the spectrum of the actual time signal $s(t)$ had an imaginary part, it would be point-symmetric about $f=0$:
- $${\rm Im}\big[S( - f)\big] = - {\rm Im}\big[S(f)\big].$$
The spectrum $S_+(f)$ of the corresponding analytical signal $s_+(t)$ is shown below. This is obtained from $S(f)$ by
- Truncating the negative frequency components: $S_+(f) \equiv 0$ für $f<0$,
- Doubling the positive frequency components: $S_+(f ) = 2 \cdot S(f )$ für $f \ge 0$.
Except for an exceptional case that is not relevant in practice, the analytical signal $s_+(t)$ is always complex.
We now apply these definitions to the modulated signal $s(t)$ . In the special case that $q(t) \equiv 0$ , $s(t)$ is a harmonic oscillation like the carrier signal $z(t)$ . It holds that:
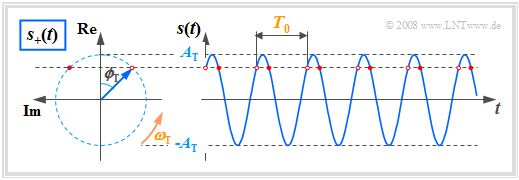
- $$s(t) = A_{\rm T} \cdot \cos(\omega_{\rm T}\cdot t + \phi_{\rm T}) \hspace{0.3cm} \Leftrightarrow \hspace{0.3cm} s_+(t) = A_{\rm T} \cdot {\rm e}^{\hspace{0.03cm}{\rm j} \hspace{0.03cm}(\omega_{\rm T}\hspace{0.05cm} t \hspace{0.05cm} + \phi_{\rm T})}\hspace{0.05cm}.$$
The second equation describes a rotating pointer with the following properties:
- The pointer length denotes the signal amplitude $A_{\rm T}$.
- At time $t = 0$ , the pointer lies in the complex plane with an angle of $ϕ_{\rm T}$ .
- For $t > 0$, the pointer rotates with constant angular velocity $ω_{\rm T}$ in a mathematically positive direction (counterclockwise).
- The pointer tip always lies on a circle with radius $A_{\rm T}$ and requires exactly the period $T_0$ for one rotation.
To be display the relation $s(t) = {\rm Re}[s_+(t)]$ horizontally, the complex plane is rotated by $90^\circ$ to the left, contrary to the usual representation:
The real part is plotted vertically and the imaginary part horizontally..
The individual modulation methods can now be represented as follows:
- In amplitude modulation the pointer length $a(t) = |s_+(t)|$ changes and thus the envelope of $s(t)$ changes according to the source signal $q(t)$.
The angular velocity $ω(t)$ remains constant in this case. - During frequency modulation the angular velocity $ω(t)$ of the rotating pointer changes according to $q(t)$,
while the pointer length $a(t) = A_{\rm T}$ stays unchanged. - In phase modulation, the phase $ϕ(t)$ is time-dependent.
There are many similarities with frequency modulation, which also belongs to the class of angle modulation.
Beschreibung des physikalischen Signals mit Hilfe des äquivalenten TP-Signals
Manche Sachverhalte bezüglich der sendeseitigen Modulation und der Demodulation am Empfänger lassen sich anhand des äquivalenten Tiefpass–Signals entsprechend der Definition im Buch „Signaldarstellung” anschaulich am besten erklären.
Für dieses Signal $s_{\rm TP}(t)$ und dessen Spektrum $S_{\rm TP}(f)$ gelten die folgenden Aussagen:
- Das Spektrum $S_{\rm TP}(f)$ des äquivalenten Tiefpass–Signals erhält man aus $S_+(f)$ durch Verschiebung um $f_{\rm T}$ nach links und liegt somit im Bereich um die Frequenz $f =0$:
- $$S_{\rm TP}(f) = S_+(f + f_{\rm T}) \hspace{0.05cm}.$$
- Für die zugehörige Zeitfunktion gilt nach dem Verschiebungssatz:
- $$s_{\rm TP}(t) = s_+(t) \cdot {\rm e}^{{-\rm j}\hspace{0.08cm} \omega_{\rm T} \hspace{0.03cm}t }\hspace{0.05cm}.$$
- Das äquivalente Tiefpass–Signal einer unmodulierten harmonischen Schwingung ist für alle Zeiten konstant – die Ortskurve besteht in diesem Sonderfall aus einem einzigen Punkt:
- $$s(t) = A_{\rm T} \cdot \cos(\omega_{\rm T}\cdot t + \phi_{\rm T}) \hspace{0.3cm} \Leftrightarrow \hspace{0.3cm} s_+(t) = {\rm e}^{\hspace{0.03cm}{\rm j} \hspace{0.03cm}(\omega_{\rm T}\hspace{0.05cm} t \hspace{0.05cm} + \phi_{\rm T})}\hspace{0.05cm},$$
- $$ s_+(t) = {\rm e}^{\hspace{0.03cm}{\rm j} \hspace{0.03cm}(\omega_{\rm T}\hspace{0.05cm} t \hspace{0.05cm} + \phi_{\rm T})}\hspace{0.3cm} \Leftrightarrow \hspace{0.3cm} s_{\rm TP}(t) = A_{\rm T} \cdot {\rm e}^{\hspace{0.03cm}{\rm j} \hspace{0.03cm} \cdot \hspace{0.05cm} \phi_{\rm T}}\hspace{0.05cm}.$$
$\text{Wichtiges Ergebnis:}$ Für ein amplituden– oder phasenmoduliertes Signal mit der Trägerfrequenz $f_{\rm T}$ gilt dagegen:
- $$s(t) = a(t) \cdot \cos(\omega_{\rm T}\cdot t + \phi(t)) \hspace{0.3cm} \Leftrightarrow \hspace{0.3cm} s_{\rm TP}(t) = a(t) \cdot {\rm e}^{\hspace{0.03cm}{\rm j} \hspace{0.03cm} \cdot \hspace{0.05cm} \phi (t)}\hspace{0.05cm}.$$
Die Hüllkurve $a(t)$ und der Phasenverlauf $ϕ(t)$ des (physikalischen) Bandpass-Signals $s(t)$ bleiben auch im äquivalenten TP–Signal $s_{\rm TP}(t)$ erhalten.
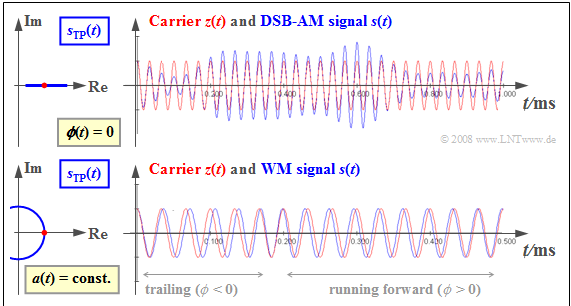
$\text{Beispiel 3:}$ Die Grafik zeigt jeweils rechts das modulierte Signal $s(t)$ ⇒ roter Signalverlauf im Vergleich zum Trägersignal $z(t)$ ⇒ blauer Signalverlauf.
Links dargestellt sind die jeweiligen äquivalenten Tiefpass–Signale $s_{\rm TP}(t)$ ⇒ grüne Ortskurven.
Oben ist die Amplitudenmodulation beschrieben, bei der das Quellensignal $q(t)$ in der Hüllkurve $a(t)$ zu erkennen ist:
- Da die Nulldurchgänge des Trägers $z(t)$ erhalten bleiben, ist $ϕ(t) = 0$ und das äquivalente TP–Signal $s_{\rm TP}(t) = a(t)$ reell.
- Die Herleitung dieses Sachverhalts erfolgt im Kapitel Beschreibung mit Hilfe des äquivalenten TP-Signals.
Unten ist die Winkelmodulation verdeutlicht.
- Hier ist die Hüllkurve $a(t)$ konstant ⇒ das äquivalente TP-Signal $s_{\rm TP}(t) = A_{\rm T} · e^{\rm j·ϕ(t)}$ beschreibt einen Kreisbogen.
- Die Information über das Nachrichtensignal $q(t)$ steckt hier in der Lage der Nulldurchgänge von $s(t)$.
- Genaueres hierüber finden Sie im Kapitel Gemeinsamkeiten zwischen PM und FM
Hinweise:
- Wir bezeichnen im Folgenden den zeitabhängigen Verlauf von $s_{\rm TP}(t)$ in der komplexen Ebene auch als "Ortskurve", während das "Zeigerdiagramm" den Verlauf des analytischen Signals $s_+(t)$ beschreibt.
- Der hier dargelegte Sachverhalt wird mit zwei interaktiven Applets im Zeitbereich verdeutlicht:
Aufgaben zum Kapitel
Aufgabe 1.4: Zeigerdiagramm und Ortskurve
Aufgabe 1.4Z: Darstellungsformen von Schwingungen
