Exercise 4.1: Low-Pass and Band-Pass Signals
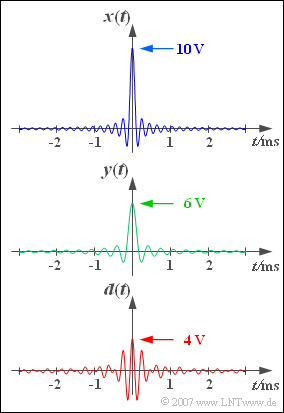
Three signal curves are sketched on the right, the first two having the following curve:
- $$x(t) = 10\hspace{0.05cm}{\rm V} \cdot {\rm si} ( \pi \cdot {t}/{T_x}) ,$$
- $$y(t) = 6\hspace{0.05cm}{\rm V} \cdot {\rm si}( \pi \cdot {t}/{T_y}) .$$
$T_x = 100 \,{\rm µ}\text{s}$ and $T_y = 166.67 \,{\rm µ}\text{s}$ indicate the first zero of $x(t)$ bzw. $y(t)$ respectively. The signal $d(t)$ results from the difference of the two upper signals (lower graph):
- $$d(t) = x(t)-y(t) .$$
In the subtask (4) the integral areas of the impulsive signals $x(t)$ and $d(t)$ are asked for. For these holds:
- $$F_x = \int_{- \infty}^{+\infty}\hspace{-0.4cm}x(t)\hspace{0.1cm}{\rm d}t , \hspace{0.5cm}F_d = \int_{- \infty}^{+\infty}\hspace{-0.4cm}d(t)\hspace{0.1cm}{\rm d}t .$$
On the other hand, for the corresponding signal energies with Parseval's theorem:
- $$E_x = \int_{- \infty}^{+\infty}\hspace{-0.4cm}|x(t)|^2\hspace{0.1cm}{\rm d}t = \int_{- \infty}^{+\infty}\hspace{-0.4cm}|X(f)|^2\hspace{0.1cm}{\rm d}f ,$$
- $$E_d = \int_{- \infty}^{+\infty}\hspace{-0.4cm}|d(t)|^2\hspace{0.1cm}{\rm d}t = \int_{- \infty}^{+\infty}\hspace{-0.4cm}|D(f)|^2\hspace{0.1cm}{\rm d}f .$$
Hints:
- This exercise belongs to the chapter Differences and Similarities of LP and BP Signals.
- The Fourier retransform of a rectangular spectrum $X(f)$ leads to an $\rm si$–shaped time function $x(t)$:
- $$X(f)=\left\{ {X_0 \; \rm f\ddot{u}r\; |\it f| < \rm B, \atop {\rm 0 \;\;\; \rm sonst}}\right. \;\; \bullet\!\!-\!\!\!-\!\!\!-\!\!\circ\, \;\;x(t) = 2 \cdot X_0 \cdot B \cdot {\rm si} ( 2\pi B t) .$$
- In this task, the function $\rm si(x) = \rm sin(x)/x = \rm sinc(x/π)$ is used.
Questions
Solution
- Die absolute, zweiseitige Bandbreite $2 \cdot B_x$ ist gleich dem Kehrwert der ersten Nullstelle. Daraus folgt:
- $$B_x = \frac{1}{2 \cdot T_x} = \frac{1}{2 \cdot 0.1 \hspace{0.1cm}{\rm ms}}\hspace{0.15 cm}\underline{ = 5 \hspace{0.1cm}{\rm kHz}}.$$
- Da der Signalwert bei $t = 0$ gleich der Rechteckfläche ist, ergibt sich für die konstante Höhe:
- $$X(f=0) = \frac{x(t=0)}{2 B_x} = \frac{10 \hspace{0.1cm}{\rm V}}{10 \hspace{0.1cm}{\rm kHz}} \hspace{0.15 cm}\underline{= 1 \hspace{0.1cm}{\rm mV/Hz}}.$$
(2) Aus $T_y = 0.167 \,\text{ms}$ erhält man $B_y \;\underline{= 3 \,\text{kHz}}$.
- Zusammen mit $y(t = 0) = 6\,\text{V}$ führt dies zum gleichen Spektralwert $Y(f = 0)\; \underline{= 1\, \text{mV/Hz}}$ wie bei der Teilaufgabe (1).
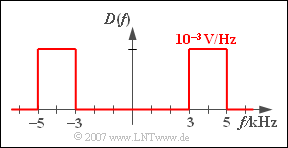
(3) Aus $d(t) = x(t) - y(t)$ folgt wegen der Linearität der Fouriertransformation: $D(f) = X(f) - Y(f).$
- Die Differenz der zwei gleich hohen Rechteckfunktionen führt zu einem rechteckförmigen Bandpass–Spektrum zwischen $3 \,\text{kHz}$ und $5 \,\text{kHz}$.
- Die (einseitige) Bandbreite beträgt somit $B_d \;\underline{= 2 \,\text{kHz}}$. In diesem Frequenzintervall ist $D(f) = 1 \,\text{mV/Hz}$. Außerhalb, also auch bei $f = 0$, gilt $D(f)\;\underline{ = 0}$.
(4) Nach den fundamentalen Gesetzmäßigkeiten der Fouriertransformation ist das Integral über die Zeitfunktion gleich dem Spektralwert bei $f = 0$. Daraus folgt:
- $$F_x = X(f=0) = \frac{x(t=0)}{2 \cdot B_x} = 10^{-3} \hspace{0.1cm}{\rm V/Hz}\hspace{0.15 cm}\underline{= 0.001 \hspace{0.1cm}{\rm Vs}},$$
- $$F_d = D(f=0) \hspace{0.15 cm}\underline{= 0}.$$
⇒ Bei jedem Bandpass–Signal sind die Flächen der positiven Signalanteile gleich groß wie die Flächen der negativen Anteile.
(5) In beiden Fällen ist die Berechnung der Signalenergie im Frequenzbereich einfacher als im Zeitbereich, da hier die Integration auf eine Flächenberechnung von Rechtecken zurückgeführt werden kann:
- $$E_x = (10^{-3} \hspace{0.1cm}{\rm V/Hz})^2 \cdot 2 \cdot 5 \hspace{0.1cm}{\rm kHz} \hspace{0.15 cm}\underline{= 0.01 \hspace{0.1cm}{\rm V^2s}},$$
- $$E_d = (10^{-3} \hspace{0.1cm}{\rm V/Hz})^2 \cdot 2 \cdot 2 \hspace{0.1cm}{\rm kHz} \hspace{0.15 cm}\underline{= 0.004 \hspace{0.1cm}{\rm V^2s}}.$$

