Contents
Probabilities of the Poisson distribution
$\text{Definition:}$ The Poisson distribution is a limiting case of the binomial distribution, where.
- on the one hand, the limit transitions $I → ∞$ and $p → 0$ are assumed,
- additionally, it is assumed that the product $I · p = λ$ has a finite value.
The parameter $λ$ gives the average number of "ones" in a fixed unit of time and is called the rate .
Further, it should be noted:
- In contrast to the binomial distribution $(0 ≤ μ ≤ I)$ here the random quantity can take on arbitrarily large (integer, non-negative) values.
- This means that the set of possible values here is uncountable.
- But since no intermediate values can occur, this is also called a discrete distribution.
$\text{Calculation rule:}$
Considering above limit transitions for the Probabilities of the binomial distribution, it follows for the Probabilities of Poisson Distribution :
- $$p_\mu = {\rm Pr} ( z=\mu ) = \lim_{I\to\infty} \cdot \frac{I !}{\mu ! \cdot (I-\mu )!} \cdot (\frac{\lambda}{I} )^\mu \cdot ( 1-\frac{\lambda}{I})^{I-\mu}.$$
From this, after some algebraic transformations, we obtain:
- $$p_\mu = \frac{ \lambda^\mu}{\mu!}\cdot {\rm e}^{-\lambda}.$$
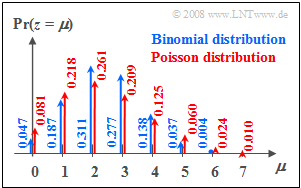
$\text{Example 1:}$ The probabilities
- of the binomial distribution with $I =6$, $p = 0.4$, and
- of the Poisson distribution with $λ = 2.4$
can be seen in the graph on the right. One can see:
- Both distributions have the same mean $m_1 = 2.4$.
- In the Poisson distribution (red arrows and labels) the "outer values" are more probable than in the binomial distribution.
- In addition, random variables $z > 6$ are also possible with the Poisson distribution; but their probabilities are also rather small at the chosen rate.
Moments of the Poisson distribution
$\text{Calculation rule:}$
The mean and rms of the Poisson distribution are obtained directly from the corresponding equations of the binomial distribution by twofold limiting:
- $$m_1 =\lim_{\left.{I\hspace{0.05cm}\to\hspace{0.05cm}\infty \atop {p\hspace{0.05cm}\to\hspace{0.05cm} 0} }\right.} I \cdot p= \lambda,$$
- $$\sigma =\lim_{\left.{I\hspace{0.05cm}\to\hspace{0.05cm}\infty \atop {p\hspace{0.05cm}\to\hspace{0.05cm} 0} }\right.} \sqrt{I \cdot p \cdot (1-p)} = \sqrt {\lambda}.$$
From this it can be seen that in the Poisson distribution it is always $σ^2 = m_1 = λ$ .
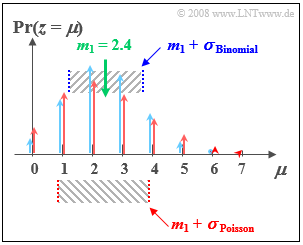
$\text{Example 2:}$
As in $\text{Example 1}$ , here we compare:
- the binomial distribution with $I =6$, $p = 0.4$, and
- and the Poisson distribution with $λ = 2.4$.
One can see from the accompanying sketch:
- Both distributions have exactly the same mean $m_1 = 2.4$.
- For the Poisson distribution (marked red in the figure), the dispersion $σ ≈ 1.55$.
- In contrast, for the (blue) binomial distribution, the standard deviation is only $σ = 1.2$.
With the interactive applet Binomial– and Poisson Distribution you can determine the probabilities and means (moments) of the Poisson distribution for any $λ$-values and visualize the similarities and differences compared to the binomial distribution.
Gegenüberstellung Binomialverteilung vs. Poissonverteilung
Nun sollen sowohl die Gemeinsamkeiten als auch die Unterschiede zwischen binomial– und poissonverteilten Zufallsgrößen nochmals herausgearbeitet werden.
Die Binomialverteilung ist zur Beschreibung von solchen stochastischen Ereignissen geeignet, die durch einen vorgegebenen Takt $T$ gekennzeichnet sind. Beispielsweise beträgt bei ISDN (Integrated Services Digital Network) mit $64 \ \rm kbit/s$ die Taktzeit $T \approx 15.6 \ \rm µ s$.
- Nur in diesem Zeitraster treten binäre Ereignisse auf. Solche Ereignisse sind zum Beispiel die fehlerfreie $(e_i = 0)$ oder fehlerhafte $(e_i = 1)$ Übertragung einzelner Symbole.
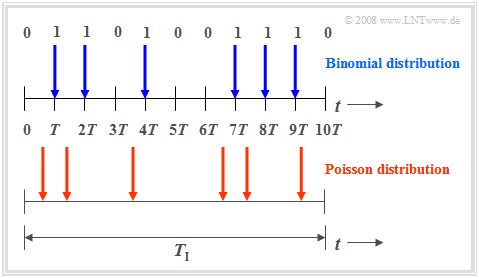
- Die Binomialverteilung ermöglicht nun statistische Aussagen über die Anzahl der in einem längeren Zeitintervall $T_{\rm I} = I · T$ zu erwartenden Übertragungsfehler entsprechend dem oberen Diagramm der folgenden Grafik (blau markierte Zeitpunkte).
Auch die Poissonverteilung macht Aussagen über die Anzahl eintretender Binärereignisse in einem endlichen Zeitintervall:
- Geht man hierbei vom gleichen Betrachtungszeitraum $T_{\rm I}$ aus und vergrößert die Anzahl $I$ der Teilintervalle immer mehr, so wird die Taktzeit $T$, zu der jeweils ein neues Binärereignis („0” oder „1”) eintreten kann, immer kleiner. Im Grenzfall geht $T$ gegen Null.
- Das heißt: Bei der Poissonverteilung sind die binären Ereignisse nicht nur zu diskreten, durch ein Zeitraster vorgegebenen Zeitpunkten möglich, sondern jederzeit. Das untere Zeitdiagramm verdeutlicht diesen Sachverhalt.
- Um im Mittel während der Zeit $T_{\rm I}$ genau so viele „Einsen” wie bei der Binomialverteilung zu erhalten (im Beispiel: sechs), muss allerdings die auf das infinitesimal kleine Zeitintervall $T$ bezogene charakteristische Wahrscheinlichkeit $p = {\rm Pr}( e_i = 1)$ gegen Null tendieren.
Anwendungen der Poissonverteilung
Die Poissonverteilung ist das Ergebnis eines so genannten Poissonprozesses. Ein solcher dient häufig als Modell für Ereignisfolgen, die zu zufälligen Zeitpunkten eintreten können. Beispiele für derartige Ereignisse sind
- der Ausfall von Geräten – eine wichtige Aufgabenstellung in der Zuverlässigkeitstheorie,
- das Schrotrauschen bei der optischen Übertragung, und
- der Beginn von Telefongesprächen in einer Vermittlungsstelle („Verkehrstheorie”).
$\text{Beispiel 3:}$ Gehen bei einer Vermittlungsstelle im Langzeitmittel neunzig Vermittlungswünsche pro Minute $($also $λ = 1.5 \text{ pro Sekunde})$ ein, so lauten die Wahrscheinlichkeiten $p_\mu$, dass in einem beliebigen Zeitraum von einer Sekunde genau $\mu$ Belegungen auftreten:
- $$p_\mu = \frac{1.5^\mu}{\mu!}\cdot {\rm e}^{-1.5}.$$
Es ergeben sich die Zahlenwerte $p_0 = 0.223$, $p_1 = 0.335$, $p_2 = 0.251$, usw.
Daraus lassen sich weitere Kenngrößen ableiten:
- Die Abstand $τ$ zwischen zwei Vermittlungswünschen genügt der Exponentialverteilung.
- Die mittlere Zeitspanne zwischen zwei Vermittlungswünschen beträgt ${\rm E}[\hspace{0.05cm}τ\hspace{0.05cm}] = 1/λ ≈ 0.667 \ \rm s$.
Aufgaben zum Kapitel
Aufgabe 2.5: „Binomial” oder „Poisson”?


